Kubernetes GPU Guide 2026: Scheduling, Sharing, Monitoring
Run GPUs on Kubernetes in 2026: install the NVIDIA GPU Operator, share GPUs with MIG or time-slicing, serve LLMs with vLLM, and monitor with DCGM.
📝 摘要
本文是一份面向 2026 年的 Kubernetes GPU 实战指南,覆盖从安装 NVIDIA GPU Operator、调度 GPU Pod、共享 GPU、部署 vLLM 推理服务,到 DCGM 监控与故障排查的完整链路。文章以 Kubernetes 1.37.1、GPU Operator v26.7.2、vLLM v0.32.0 为基准,强调 GPU 与 CPU/内存的根本差异:默认按整卡分配、不可超卖、依赖 K8s 之外的内核驱动与容器工具链,且 kubectl top 完全看不到 GPU 使用率。共享方案按隔离强度分为独占、MIG(硬件分区)、时间片(无隔离)、MPS(实验性)与 DRA(1.34 起 GA 的属性化分配),并给出各自适用场景。监控侧以 DCGM Exporter 暴露的 DCGM_FI_DEV_GPU_UTIL、显存、温度、XID 等指标为核心,配合 Prometheus 与 Grafana 面板 12219,并给出可直接落地的告警规则。文章还提供了 vLLM 部署清单、常见故障的逐层排查路径(调度器→节点资源→device plugin→运行时→驱动)以及成本优化清单。
核心概念: GPU 在 Kubernetes 中是"可计数但不可超卖的扩展资源",真正的工程难点不是让它跑起来,而是可靠地共享、精确地观测、并识别被浪费的整卡。
关键技术栈 / 关键要点:
- GPU Operator — 用一份 Helm Chart 以 DaemonSet 方式安装驱动、Container Toolkit、device plugin、GFD、MIG Manager 与 DCGM Exporter;托管 K8s 上需关闭
driver.enabled避免双重驱动。 - 调度约束 — 必须在
limits中请求整数个nvidia.com/gpu,request 必须等于 limit;用 GFD 标签(如nvidia.com/gpu.product)选卡,并给 GPU 节点打 taint 防止 CPU Pod 抢占。 - 共享策略 — MIG 提供硬件级隔离(Ampere+,最多 7 片),时间片无内存与故障隔离但适合开发/CI,MPS 提供等额资源配额但仍属实验特性,DRA 则支持按显存等属性声明式选卡。
- vLLM 推理落地 — 需持久化模型缓存、放大
/dev/shm、配置足够长的startupProbe,并用strategy: Recreate避免单卡节点滚动更新时出现第二个 GPU 需求。 - 监控与告警 — DCGM Exporter 在
:9400/metrics暴露指标;GPU_UTIL只表示"有 kernel 在跑",效率判断应看GR_ENGINE_ACTIVE/PIPE_TENSOR_ACTIVE;时间片模式下无法做 Pod 级归因。 - 扩容信号 — LLM 服务不应基于 CPU 做 HPA,应基于 vLLM 的
vllm:num_requests_waiting等队列深度指标,并配合 KEDA/Karpenter,同时保留热副本以抵消分钟级冷启动。 - 成本优化 — 顺序为:先测量 → 按需降配 → 在可隔离处共享 → 用
MostAllocated/KAI Scheduler 装箱 → 能用则缩容到零 → 清理闲置 Job/Notebook → 可中断任务用 Spot → 用 Kueue 排队替代各团队自留缓冲。
关键结论 / 实践建议: 2026 年仍应从成熟的 device plugin 路径起步,仅在需要属性化选卡或更丰富共享时迁移到 DRA;生产落地的最低要求是:驱动只有一个归属方、GPU 节点有 taint、按命名空间设置 requests.nvidia.com/gpu 配额、DCGM 指标接入 Prometheus 并配置温度/显存/XID/闲置告警。文中命令未在真实 GPU 硬件上执行,需按每步的验证模式自行确认。
Kubernetes GPU Guide 2026 cover showing a GPU split into slices connected to Kubernetes pods and a monitoring chart.
Short answer: To run GPU workloads on Kubernetes, install the NVIDIA GPU Operator (it sets up the driver, container toolkit, device plugin, and DCGM monitoring on every GPU node), then request GPUs in your pod spec with resources.limits: nvidia.com/gpu: 1. GPUs are allocated as whole units by default. To share one GPU between pods, use MIG for hardware isolation on supported GPUs, or time-slicing when isolation does not matter. For new clusters on Kubernetes 1.34 or later, Dynamic Resource Allocation (DRA) is now the stable, more flexible way to request GPUs.
This guide walks through every layer, with working manifests, a vLLM inference lab, DCGM monitoring, and the errors you will actually hit.
Versions used in this guide (checked October 2026): Kubernetes 1.37.1 (1.35, 1.36 and 1.37 are the supported minor versions), NVIDIA GPU Operator v26.7.2, vLLM v0.32.0. Pin versions in your own setup and check the release notes linked at the end before you install.
Test status: The commands and manifests below follow the official NVIDIA, Kubernetes and vLLM documentation. They have not been run on GPU hardware for this article. Each step includes a verification command and the output pattern the docs describe, so you can confirm results on your own cluster.
Why GPUs matter in Kubernetes in 2026
Most platform teams now run at least one of these on Kubernetes:
- Model training and fine-tuning jobs that need several GPUs for hours or days.
- LLM inference services that need a GPU around the clock, with traffic that rises and falls.
- Batch AI work like embeddings, transcription, and evaluation runs.
Kubernetes is a good fit because you already use it for scheduling, rollouts, quotas and monitoring. The hard part is that GPUs do not behave like CPU and memory:
- They are expensive and scarce. An idle GPU node costs the same as a busy one.
- They are allocated as whole devices by default. A small model that uses 4 GB of an 80 GB GPU still locks the whole card.
- They depend on a stack outside Kubernetes. Kernel driver, container runtime hooks, and firmware all have to line up.
- Normal metrics hide the problem.
kubectl topdoes not show GPU usage at all.
So the real job is not “make GPUs work”. It is: make them work reliably, share them safely, and see whether you are wasting them.
How GPUs work in Kubernetes
Kubernetes does not know what a GPU is. It learns about GPUs through a device plugin (or, newer, a DRA driver) that runs on each GPU node and tells the kubelet “this node has N devices called nvidia.com/gpu “. The scheduler then treats that as a countable resource.
Here is the full path from a pod spec to a physical GPU:
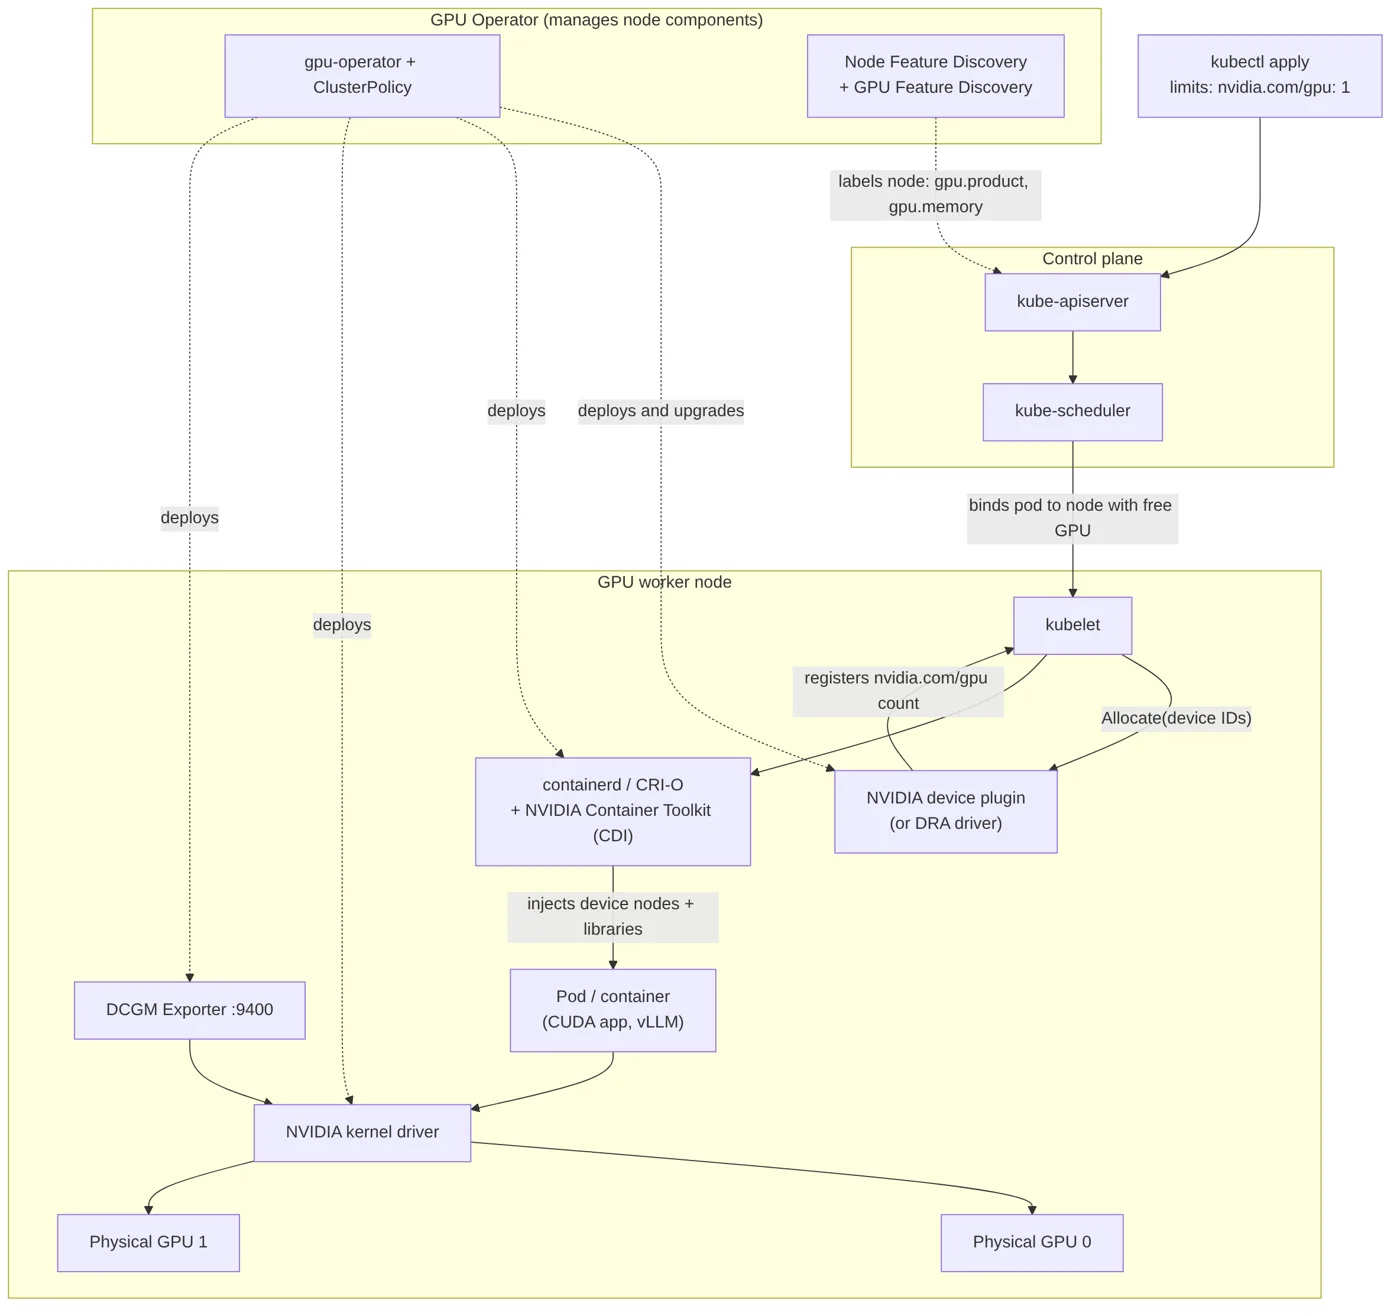
Architecture diagram showing the Kubernetes control plane scheduling a GPU pod onto a worker node, where the NVIDIA device plugin, container toolkit, and kernel driver connect the container to physical GPUs, all managed by the NVIDIA GPU Operator.
The pieces, in plain terms:
| Component | What it does | Why you care |
|---|---|---|
| NVIDIA driver | Kernel module that talks to the GPU | Must match the CUDA version your images expect (driver must be new enough) |
| NVIDIA Container Toolkit | Makes GPU devices and driver libraries visible inside containers, now through CDI (Container Device Interface) | Without it, the container starts but sees no GPU |
| Device plugin | Advertises nvidia.com/gpu to the kubelet and assigns specific GPUs to containers |
This is what makes the scheduler GPU-aware |
| GPU Feature Discovery (GFD) | Adds labels like nvidia.com/gpu.product and nvidia.com/gpu.memory |
Lets you target a GPU model with nodeSelector |
| DCGM Exporter | Exposes GPU metrics in Prometheus format | Your only reliable view of GPU usage |
| MIG Manager | Applies MIG partition layouts on supported GPUs | Needed for hardware GPU sharing |
| GPU Operator | Installs and upgrades all of the above as DaemonSets | One Helm chart instead of hand-configuring every node |
Device plugins vs Dynamic Resource Allocation (DRA)
The device plugin model only understands counts: “give me 1 GPU”. Dynamic Resource Allocation lets a pod describe which device it needs (for example, a GPU with at least 40 GB of memory) using ResourceClaim objects and CEL selectors. DRA reached GA in Kubernetes 1.34 with the resource.k8s.io/v1 API.
NVIDIA’s DRA driver for GPUs now lives under Kubernetes SIGs, and GPU Operator 26.7 can manage it. The Operator docs list these requirements for DRA: Kubernetes v1.34.2 or later, NVIDIA driver 580 or later, and a CDI-capable runtime. Some DRA driver features, such as time-slicing settings, are still alpha and off by default.
Practical advice for 2026: the device plugin path is still the most widely documented and is what most managed Kubernetes services use by default. Start there. Move to DRA when you need attribute-based selection or richer sharing, and test it on a non-production cluster first. Many articles that rank today still show resource.k8s.io/v1beta2 examples; on current clusters use resource.k8s.io/v1.
Setting up GPU support with the NVIDIA GPU Operator
Prerequisites
- A Kubernetes cluster running a supported version (1.35 to 1.37 at the time of writing).
- At least one worker node with an NVIDIA data center GPU (for a lab, a single cloud VM with an L4 or T4 is enough).
containerdorCRI-Oas the container runtime.kubectlandhelm3 on your workstation.- If you let the Operator install drivers, all GPU nodes should run the same OS version.
Managed Kubernetes note: GKE, EKS and AKS can install drivers for you on GPU node pools. In that case, install the Operator with
driver.enabled=false(andtoolkit.enabled=falseif the toolkit is also preinstalled), or follow your provider’s GPU guide. Running two driver installers on one node is a common cause of broken nodes.
Step 1: Prepare the namespace
If Pod Security Admission is enforced, the Operator namespace needs the privileged level, because driver and toolkit pods touch the host:
kubectl create namespace gpu-operator
kubectl label --overwrite namespace gpu-operator \
  pod-security.kubernetes.io/enforce=privileged
Verify:
kubectl get namespace gpu-operator --show-labels
You should see pod-security.kubernetes.io/enforce=privileged in the labels.
Step 2: Install the GPU Operator with Helm
helm repo add nvidia https://helm.ngc.nvidia.com/nvidia
helm repo update

helm install --wait gpu-operator \
  -n gpu-operator \
  nvidia/gpu-operator \
  --version=v26.7.2
Common options (pass with --set):
| Option | Use it when |
|---|---|
driver.enabled=false |
Drivers are already installed on the nodes (common on managed Kubernetes) |
toolkit.enabled=false |
NVIDIA Container Toolkit is already installed |
nfd.enabled=false |
Node Feature Discovery already runs in the cluster |
mig.strategy=mixed |
You plan to use more than one MIG profile size on a GPU |
dcgmExporter.serviceMonitor.enabled=true |
You run the Prometheus Operator and want automatic scraping |
To see every option for your chart version: helm show values nvidia/gpu-operator --version=v26.7.2.
Since GPU Operator 25.10, CDI is enabled by default and the old cdi.default setting is ignored. If you are upgrading an older install with custom CDI flags, review them.
Step 3: Verify the Operator
Driver installation can take several minutes per node, because the driver container may compile or load kernel modules.
kubectl get pods -n gpu-operator
Expected pattern: every pod is Running or Completed. You will typically see pods with names starting with gpu-operator, nvidia-driver-daemonset (if drivers are managed), nvidia-container-toolkit-daemonset, nvidia-device-plugin-daemonset, gpu-feature-discovery, nvidia-dcgm-exporter, and nvidia-operator-validator. The nvidia-cuda-validator pod should end as Completed.
kubectl get clusterpolicy
Expected pattern: the ClusterPolicy status shows ready.
Step 4: Confirm the node advertises GPUs
kubectl get nodes -o json | jq '.items[]
  | select(.status.allocatable["nvidia.com/gpu"] != null)
  | {name: .metadata.name, gpus: .status.allocatable["nvidia.com/gpu"]}'
Expected pattern: one entry per GPU node with a gpus value equal to the number of physical GPUs (for example "1").
Check the labels GPU Feature Discovery added:
kubectl get node <gpu-node> -o json | jq '.metadata.labels
  | with_entries(select(.key | startswith("nvidia.com/gpu")))'
You should see keys such as nvidia.com/gpu.product, nvidia.com/gpu.memory, and nvidia.com/gpu.count.
Step 5: Run the CUDA smoke test
# cuda-vectoradd.yaml
apiVersion: v1
kind: Pod
metadata:
  name: cuda-vectoradd
spec:
  restartPolicy: OnFailure
  containers:
    - name: cuda-vectoradd
      image: nvcr.io/nvidia/k8s/cuda-sample:vectoradd-cuda12.5.0-ubuntu22.04
      resources:
        limits:
          nvidia.com/gpu: 1
kubectl apply -f cuda-vectoradd.yaml
kubectl logs pod/cuda-vectoradd
Expected pattern: the log ends with Test PASSED followed by Done. If you see that, the driver, toolkit, device plugin and scheduler are all working together. Clean up with kubectl delete -f cuda-vectoradd.yaml.
Scheduling your first GPU pod
GPUs are an extended resource. Three rules from the Kubernetes docs shape everything you do with them:
- You set GPUs in
limits. If you only set a limit, Kubernetes sets the request to the same value. - If you set both, the request must equal the limit. GPUs cannot be overcommitted.
- You must ask for whole numbers.
0.5is not valid. Fractions come from sharing features, not from the request.
Here is a realistic manifest for a GPU workload that targets a specific GPU type and tolerates a GPU taint:
# gpu-pod.yaml
apiVersion: v1
kind: Pod
metadata:
  name: gpu-smi
  labels:
    app: gpu-smi
spec:
  restartPolicy: Never
  # Only land on nodes with this GPU model (label from GPU Feature Discovery).
  # Replace the value with what your node shows for nvidia.com/gpu.product.
  nodeSelector:
    nvidia.com/gpu.product: NVIDIA-L4
  # Allow scheduling on GPU nodes you have tainted to keep CPU pods away.
  tolerations:
    - key: nvidia.com/gpu
      operator: Exists
      effect: NoSchedule
  containers:
    - name: cuda
      image: nvcr.io/nvidia/cuda:12.5.0-base-ubuntu22.04
      command: ["nvidia-smi"]
      resources:
        limits:
          nvidia.com/gpu: 1
          cpu: "2"
          memory: 4Gi
        requests:
          cpu: "1"
          memory: 2Gi
kubectl apply -f gpu-pod.yaml
kubectl get pod gpu-smi -o wide
kubectl logs gpu-smi
Expected pattern: the pod runs on a GPU node and the log shows the standard nvidia-smi table with one GPU listed, the driver version and the CUDA version.
What the scheduler does behind the scenes:
- It filters out nodes whose allocatable
nvidia.com/gpuminus already allocated GPUs is less than 1. - It applies your
nodeSelectorand taints and tolerations. - On the chosen node, the kubelet asks the device plugin for a specific GPU ID. The container only sees that GPU, which is why
nvidia-smiinside the pod shows one device even on an 8-GPU node.
Taint your GPU nodes. Without a taint, ordinary CPU pods can fill a GPU node’s CPU and memory, and your GPU pod then sits in Pending even though the GPU is free:
kubectl taint nodes <gpu-node> nvidia.com/gpu=present:NoSchedule
GPU sharing strategies: MIG, time-slicing, MPS, and DRA
By default one GPU goes to one container. That is safe but wasteful for small models, notebooks and dev environments. Here are the options NVIDIA supports today.
Comparison table
| Strategy | Isolation | Memory limits per workload | Hardware needed | Maturity | Best for |
|---|---|---|---|---|---|
| Exclusive (default) | Full: one container per GPU | Whole GPU | Any NVIDIA GPU | Stable | Training, large-model inference, anything latency sensitive |
| MIG (Multi-Instance GPU) | Hardware: separate compute, memory and cache slices | Yes, fixed per slice | Ampere or newer data center GPUs that support MIG (for example A100, A30, H100 class) | Stable | Multi-tenant inference, predictable small workloads |
| Time-slicing | None: shared memory, a crash can affect all users | No | Any supported NVIDIA GPU | Stable in device plugin | Dev, notebooks, CI, bursty light jobs |
| MPS (Multi-Process Service) | Partial: memory and compute caps per client | Yes, equal fraction | Full GPUs only, not with MIG | Experimental in device plugin | Many small, steady inference processes |
| DRA sharing | Depends on driver config | Depends on config | Kubernetes 1.34.2+, driver 580+, CDI runtime | Core API GA; NVIDIA sharing features partly alpha | Attribute-based allocation, future-proof clusters |
How to choose
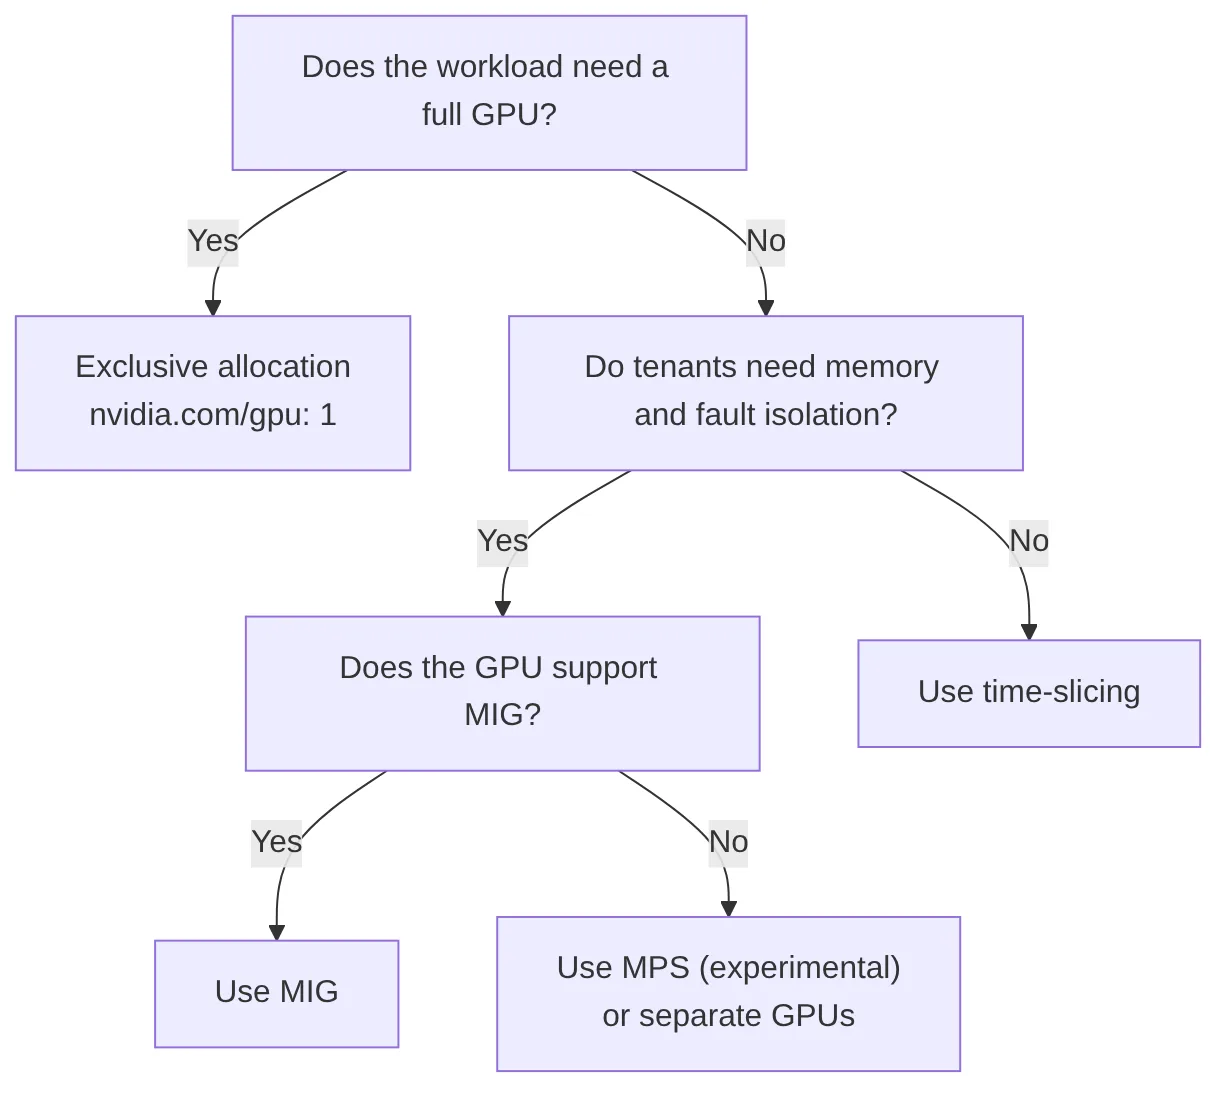
Decision flowchart for choosing between exclusive GPU allocation, MIG, MPS, and time-slicing in Kubernetes based on isolation needs and hardware support.
Option 1: MIG configuration on Kubernetes
MIG splits one physical GPU into up to seven isolated instances. Each has its own memory and compute, so a noisy neighbor cannot slow you down or crash you.
The GPU Operator includes MIG Manager. You pick a layout by labeling the node:
# Example: split every GPU on the node into 1g.10gb slices (H100 80GB style profile)
kubectl label nodes <gpu-node> nvidia.com/mig.config=all-1g.10gb --overwrite
MIG Manager drains GPU pods on that node, reconfigures the GPUs, and updates a state label. Watch it:
kubectl get node <gpu-node> -o jsonpath='{.metadata.labels.nvidia\.com/mig\.config\.state}'
Expected pattern: the value moves from pending (or rebooting) to success.
Check the MIG devices from the driver pod:
kubectl exec -n gpu-operator ds/nvidia-driver-daemonset -- nvidia-smi -L
Expected pattern: lines such as MIG 1g.10gb Device 0: (UUID: MIG-...) under each GPU.
How pods request MIG slices depends on the MIG strategy:
single(default): every GPU on the node uses the same profile. Slices are still requested asnvidia.com/gpu: 1. UsenodeSelectoronnvidia.com/gpu.product(it gets a MIG suffix) to target them.mixed: different profile sizes can exist. Each size becomes its own resource, such asnvidia.com/mig-1g.10gb.
# mig-pod.yaml (mixed strategy)
apiVersion: v1
kind: Pod
metadata:
  name: mig-test
spec:
  restartPolicy: Never
  containers:
    - name: cuda
      image: nvcr.io/nvidia/cuda:12.5.0-base-ubuntu22.04
      command: ["nvidia-smi", "-L"]
      resources:
        limits:
          nvidia.com/mig-1g.10gb: 1
Profile names depend on the GPU model. Check what your hardware supports in the NVIDIA MIG User Guide before picking a layout.
Option 2: GPU time-slicing
Time-slicing tells the device plugin to advertise each GPU as several “replicas”. Pods take turns on the GPU. There is no memory or fault isolation: one pod can use all GPU memory and cause out-of-memory errors in the others.
Create the config in the Operator namespace:
# time-slicing-config.yaml
apiVersion: v1
kind: ConfigMap
metadata:
  name: time-slicing-config-all
  namespace: gpu-operator
data:
  any: |-
    version: v1
    flags:
      migStrategy: none
    sharing:
      timeSlicing:
        renameByDefault: false
        failRequestsGreaterThanOne: true
        resources:
          - name: nvidia.com/gpu
            replicas: 4
kubectl apply -f time-slicing-config.yaml

kubectl patch clusterpolicies.nvidia.com/cluster-policy \
  -n gpu-operator --type merge \
  -p '{"spec": {"devicePlugin": {"config": {"name": "time-slicing-config-all", "default": "any"}}}}'
Verify:
kubectl describe node <gpu-node> | grep -E "nvidia.com/gpu|gpu.replicas|gpu.product"
Expected pattern: on a node with 1 GPU and 4 replicas, nvidia.com/gpu capacity becomes 4, the label nvidia.com/gpu.replicas=4 appears, and the product label gets a -SHARED suffix. nvidia.com/gpu.count still shows the real number of GPUs.
Three details that catch people out:
failRequestsGreaterThanOne: truerejects pods that ask for more than one replica. Asking for 2 replicas does not give you twice the compute, so it is better to fail loudly. Rejected pods showUnexpectedAdmissionError.- The Operator does not watch the ConfigMap. After editing it, restart the plugin:
kubectl rollout restart -n gpu-operator daemonset/nvidia-device-plugin-daemonset. - DCGM Exporter cannot map metrics to individual containers when time-slicing is on. You get per-GPU metrics only.
Option 3: MPS
The device plugin supports NVIDIA MPS through a sharing.mps block that looks like the time-slicing config. MPS gives each client an equal share of GPU memory and caps its compute, which is more predictable than time-slicing. The device plugin marks it experimental, it does not work on MIG-enabled GPUs, and it cannot be combined with time-slicing on the same node. Use it only after testing.
Outside NVIDIA’s own tools, CNCF projects such as HAMi add GPU memory and compute limits on top of sharing. See GPU Sharing on Kubernetes: What HAMi Showed at KubeCon China 2026.
Option 4: DRA-based GPU requests
With the NVIDIA DRA driver installed, a pod requests a GPU through a claim instead of a counted resource:
# dra-gpu.yaml (requires Kubernetes 1.34+ and the NVIDIA DRA driver)
apiVersion: resource.k8s.io/v1
kind: ResourceClaimTemplate
metadata:
  name: single-gpu
spec:
  spec:
    devices:
      requests:
        - name: gpu
          exactly:
            deviceClassName: gpu.nvidia.com
            count: 1
---
apiVersion: v1
kind: Pod
metadata:
  name: dra-gpu-test
spec:
  restartPolicy: Never
  resourceClaims:
    - name: gpu
      resourceClaimTemplateName: single-gpu
  containers:
    - name: cuda
      image: nvcr.io/nvidia/cuda:12.5.0-base-ubuntu22.04
      command: ["nvidia-smi", "-L"]
      resources:
        claims:
          - name: gpu
Verify: kubectl get resourceclaims shows a claim with state allocated,reserved, and kubectl get resourceslices lists the GPUs the driver published. Do not run the device plugin and the DRA driver against the same GPUs on one node unless your Operator version documents that setup.
Lab: running LLM inference on Kubernetes with vLLM
This lab deploys an OpenAI-compatible LLM endpoint with vLLM on one GPU. It uses Qwen/Qwen2.5-1.5B-Instruct, a small model that is not gated on Hugging Face and fits comfortably on a 16 GB or 24 GB GPU. Swap in a larger model once the pipeline works.
Test status: untested on hardware for this article. Manifests are adapted from the vLLM Kubernetes deployment guide.
Model access and storage decisions
- Gated models (Llama, some Mistral and Gemma models) need a Hugging Face token with access approved. Store it in a Secret, never in the manifest.
- Model cache: vLLM downloads weights to
~/.cache/huggingfaceon first start. Without a PersistentVolume, every pod restart downloads the model again. That is slow, and on autoscaled nodes it multiplies egress costs. - Shared memory: vLLM needs a larger
/dev/shmthan the container default, especially with tensor parallelism. Mount an in-memoryemptyDir. - Startup time: loading weights and compiling CUDA graphs can take minutes. Use a
startupProbewith a generous budget so the kubelet does not kill the pod while it is still loading.
Step 1: Namespace, secret and model cache
# vllm-base.yaml
apiVersion: v1
kind: Namespace
metadata:
  name: llm
---
apiVersion: v1
kind: Secret
metadata:
  name: hf-token
  namespace: llm
type: Opaque
stringData:
  token: "REPLACE_WITH_YOUR_HF_TOKEN"   # only needed for gated models
---
apiVersion: v1
kind: PersistentVolumeClaim
metadata:
  name: model-cache
  namespace: llm
spec:
  accessModes: ["ReadWriteOnce"]
  resources:
    requests:
      storage: 50Gi
  # storageClassName: <your-storage-class>
kubectl apply -f vllm-base.yaml
kubectl get pvc -n llm
Expected pattern: the PVC is Bound, or Pending until the first pod uses it if your storage class uses WaitForFirstConsumer.
Step 2: The vLLM Deployment and Service
# vllm-deploy.yaml
apiVersion: apps/v1
kind: Deployment
metadata:
  name: qwen-vllm
  namespace: llm
  labels:
    app: qwen-vllm
spec:
  replicas: 1
  strategy:
    type: Recreate          # one GPU, so do not try to run old and new pods at once
  selector:
    matchLabels:
      app: qwen-vllm
  template:
    metadata:
      labels:
        app: qwen-vllm
    spec:
      tolerations:
        - key: nvidia.com/gpu
          operator: Exists
          effect: NoSchedule
      volumes:
        - name: model-cache
          persistentVolumeClaim:
            claimName: model-cache
        - name: shm
          emptyDir:
            medium: Memory
            sizeLimit: 2Gi
      containers:
        - name: vllm
          image: vllm/vllm-openai:v0.32.0
          command: ["vllm", "serve"]
          args:
            - "Qwen/Qwen2.5-1.5B-Instruct"
            - "--max-model-len"
            - "8192"
            - "--gpu-memory-utilization"
            - "0.90"
            - "--port"
            - "8000"
          env:
            - name: HF_TOKEN
              valueFrom:
                secretKeyRef:
                  name: hf-token
                  key: token
                  optional: true
          ports:
            - name: http
              containerPort: 8000
          resources:
            limits:
              nvidia.com/gpu: 1
              cpu: "4"
              memory: 16Gi
            requests:
              cpu: "2"
              memory: 8Gi
          volumeMounts:
            - name: model-cache
              mountPath: /root/.cache/huggingface
            - name: shm
              mountPath: /dev/shm
          startupProbe:
            httpGet:
              path: /health
              port: 8000
            periodSeconds: 10
            failureThreshold: 60     # up to 10 minutes to download and load
          readinessProbe:
            httpGet:
              path: /health
              port: 8000
            periodSeconds: 5
          livenessProbe:
            httpGet:
              path: /health
              port: 8000
            periodSeconds: 15
            failureThreshold: 3
---
apiVersion: v1
kind: Service
metadata:
  name: qwen-vllm
  namespace: llm
  labels:
    app: qwen-vllm
spec:
  selector:
    app: qwen-vllm
  ports:
    - name: http
      port: 80
      targetPort: 8000
The image is the official vllm/vllm-openai image. Setting command: ["vllm", "serve"] explicitly starts the OpenAI-compatible server no matter how the image entrypoint changes between releases. Pin a version tag instead of latest, so a new release does not change your server on the next restart.
kubectl apply -f vllm-deploy.yaml
kubectl get pods -n llm -w
Step 3: Validate the endpoint
Follow the logs while the model loads:
kubectl logs -n llm deploy/qwen-vllm -f
Expected pattern: log lines about downloading or loading model weights, then the API server starting on port 8000. The pod becomes 1/1 Ready once /health returns 200.
Test it from your workstation:
kubectl port-forward -n llm svc/qwen-vllm 8000:80

# In a second terminal
curl -s http://localhost:8000/v1/models | jq

curl -s http://localhost:8000/v1/chat/completions \
  -H "Content-Type: application/json" \
  -d '{
        "model": "Qwen/Qwen2.5-1.5B-Instruct",
        "messages": [{"role": "user", "content": "Explain a Kubernetes device plugin in one sentence."}],
        "max_tokens": 80
      }' | jq -r '.choices[0].message.content'
Expected pattern: /v1/models lists the model ID, and the chat call returns a short text answer.
Confirm the pod really uses the GPU:
kubectl exec -n llm deploy/qwen-vllm -- nvidia-smi
Expected pattern: a python or vllm process using most of the GPU memory. That is normal: --gpu-memory-utilization 0.90 tells vLLM to reserve 90% of GPU memory for weights and KV cache up front.
Troubleshooting the vLLM lab
| Symptom | Likely cause | Fix |
|---|---|---|
| Pod restarts during startup, events show failed startup probe | Model load takes longer than the probe allows | Raise startupProbe.failureThreshold |
401 or 403 errors from Hugging Face in logs |
Gated model and missing or unapproved token | Request access on the model page and check the Secret |
| CUDA out of memory at startup | Model plus KV cache does not fit | Lower --max-model-len, lower --gpu-memory-utilization, or use a smaller or quantized model |
| Errors mentioning shared memory or NCCL with multiple GPUs | /dev/shm too small |
Increase the shm sizeLimit |
Pod stuck Pending with Insufficient nvidia.com/gpu |
GPU already taken by another pod, or a rolling update needs a second GPU | Use strategy: Recreate on single-GPU nodes, or add capacity |
Scaling inference
- Horizontal scaling: CPU-based HPA is the wrong signal for LLM serving. vLLM exposes Prometheus metrics at
/metrics, includingvllm:num_requests_runningandvllm:num_requests_waiting. Scale on queue depth with KEDA or the Prometheus Adapter. Check/metricson your version first, since metric names can change between releases. - Node scaling: pair it with Cluster Autoscaler or Karpenter on a GPU node group. Expect a new GPU node to take minutes (node boot, driver load, image pull, model load), so keep at least one warm replica for user-facing traffic.
- Large models: use
--tensor-parallel-sizeto spread one model across GPUs on a node. For multi-node serving, look at projects built for it, such as the vLLM production stack, KServe, or llm-d, rather than hand-rolling it. For how llm-d splits prefill and decode across GPUs, read Prefill and Decode Disaggregation with llm-d.
GPU monitoring with DCGM Exporter, Prometheus, and Grafana
The GPU Operator deploys DCGM Exporter by default. It exposes metrics on port 9400 at /metrics.
Step 1: Check the exporter directly
kubectl get svc -n gpu-operator | grep dcgm
kubectl port-forward -n gpu-operator svc/nvidia-dcgm-exporter 9400:9400

# In another terminal
curl -s localhost:9400/metrics | grep -E "^DCGM_FI_DEV_(GPU_UTIL|FB_USED|GPU_TEMP)"
Expected pattern: one line per GPU for each metric, with labels such as gpu, UUID, modelName and Hostname. When a GPU pod is running, you also see namespace, pod and container labels that map the GPU to the workload (not available with time-slicing).
Step 2: Scrape with Prometheus
If you use the Prometheus Operator (for example kube-prometheus-stack), enable the ServiceMonitor in the GPU Operator:
helm upgrade gpu-operator nvidia/gpu-operator -n gpu-operator \
  --version=v26.7.2 --reuse-values \
  --set dcgmExporter.serviceMonitor.enabled=true
Your Prometheus must be allowed to select ServiceMonitors in the gpu-operator namespace. With kube-prometheus-stack, that usually means setting prometheus.prometheusSpec.serviceMonitorSelectorNilUsesHelmValues=false.
Verify: in the Prometheus UI, run DCGM_FI_DEV_GPU_UTIL. You should get one series per GPU. Note that after scraping, the workload label may appear as exported_pod and exported_namespace because Prometheus renames labels that clash with its own target labels.
The metrics that matter
| Metric | Meaning | What to watch for |
|---|---|---|
DCGM_FI_DEV_GPU_UTIL |
Percent of time the GPU was busy | Low values on allocated GPUs mean waste |
DCGM_FI_PROF_GR_ENGINE_ACTIVE |
Fraction of time the graphics/compute engine was active | A more accurate busy signal than GPU_UTIL on data center GPUs |
DCGM_FI_PROF_PIPE_TENSOR_ACTIVE |
Tensor core activity | Shows whether AI workloads use the tensor cores at all |
DCGM_FI_DEV_FB_USED / DCGM_FI_DEV_FB_FREE |
GPU memory used and free (MiB) | Near-full memory precedes OOM errors |
DCGM_FI_DEV_GPU_TEMP |
GPU temperature (°C) | Sustained high values lead to clock throttling |
DCGM_FI_DEV_POWER_USAGE |
Power draw (W) | Useful for capacity and cost reporting |
DCGM_FI_DEV_XID_ERRORS |
Last XID error code from the driver | Any non-zero value deserves a look; some XIDs mean the GPU needs a reset |
DCGM_FI_DEV_UNCORRECTABLE_REMAPPED_ROWS |
Memory rows remapped after uncorrectable errors | Hardware health signal |
GPU_UTIL only says “a kernel was running”, not how hard the GPU worked. A GPU can show high GPU_UTIL while doing little real work. When the profiling metrics are available, use GR_ENGINE_ACTIVE and PIPE_TENSOR_ACTIVE for efficiency questions.
Step 3: Grafana dashboard
Import NVIDIA’s DCGM Exporter dashboard from grafana.com (dashboard ID 12219) and point it at your Prometheus data source. Then add a panel that answers the cost question directly: GPU utilization grouped by namespace.
avg by (exported_namespace) (DCGM_FI_DEV_GPU_UTIL)
Step 4: Alerts worth having
# gpu-alerts.yaml (PrometheusRule for the Prometheus Operator)
apiVersion: monitoring.coreos.com/v1
kind: PrometheusRule
metadata:
  name: gpu-alerts
  namespace: gpu-operator
spec:
  groups:
    - name: gpu.rules
      rules:
        - alert: GPUHighTemperature
          expr: DCGM_FI_DEV_GPU_TEMP > 85
          for: 10m
          labels:
            severity: warning
          annotations:
            summary: "GPU {{ $labels.gpu }} on {{ $labels.Hostname }} above 85C for 10m"
        - alert: GPUMemoryNearlyFull
          expr: DCGM_FI_DEV_FB_USED / (DCGM_FI_DEV_FB_USED + DCGM_FI_DEV_FB_FREE) > 0.95
          for: 15m
          labels:
            severity: warning
          annotations:
            summary: "GPU memory above 95% on {{ $labels.Hostname }}"
        - alert: GPUXidError
          expr: DCGM_FI_DEV_XID_ERRORS > 0
          for: 1m
          labels:
            severity: critical
          annotations:
            summary: "XID error {{ $value }} on GPU {{ $labels.gpu }} ({{ $labels.Hostname }})"
        - alert: GPUAllocatedButIdle
          expr: avg_over_time(DCGM_FI_DEV_GPU_UTIL{exported_pod!=""}[2h]) < 5
          for: 30m
          labels:
            severity: info
          annotations:
            summary: "Pod {{ $labels.exported_pod }} holds a GPU but used under 5% for 2h"
Tune the thresholds to your hardware. Check your GPU’s documented temperature limits rather than copying 85°C blindly, and adjust the label names if your Prometheus does not rename them to exported_*.
Troubleshooting common GPU scheduling problems
Work from the outside in: scheduler, then node resources, then the device plugin, then the runtime, then the driver.
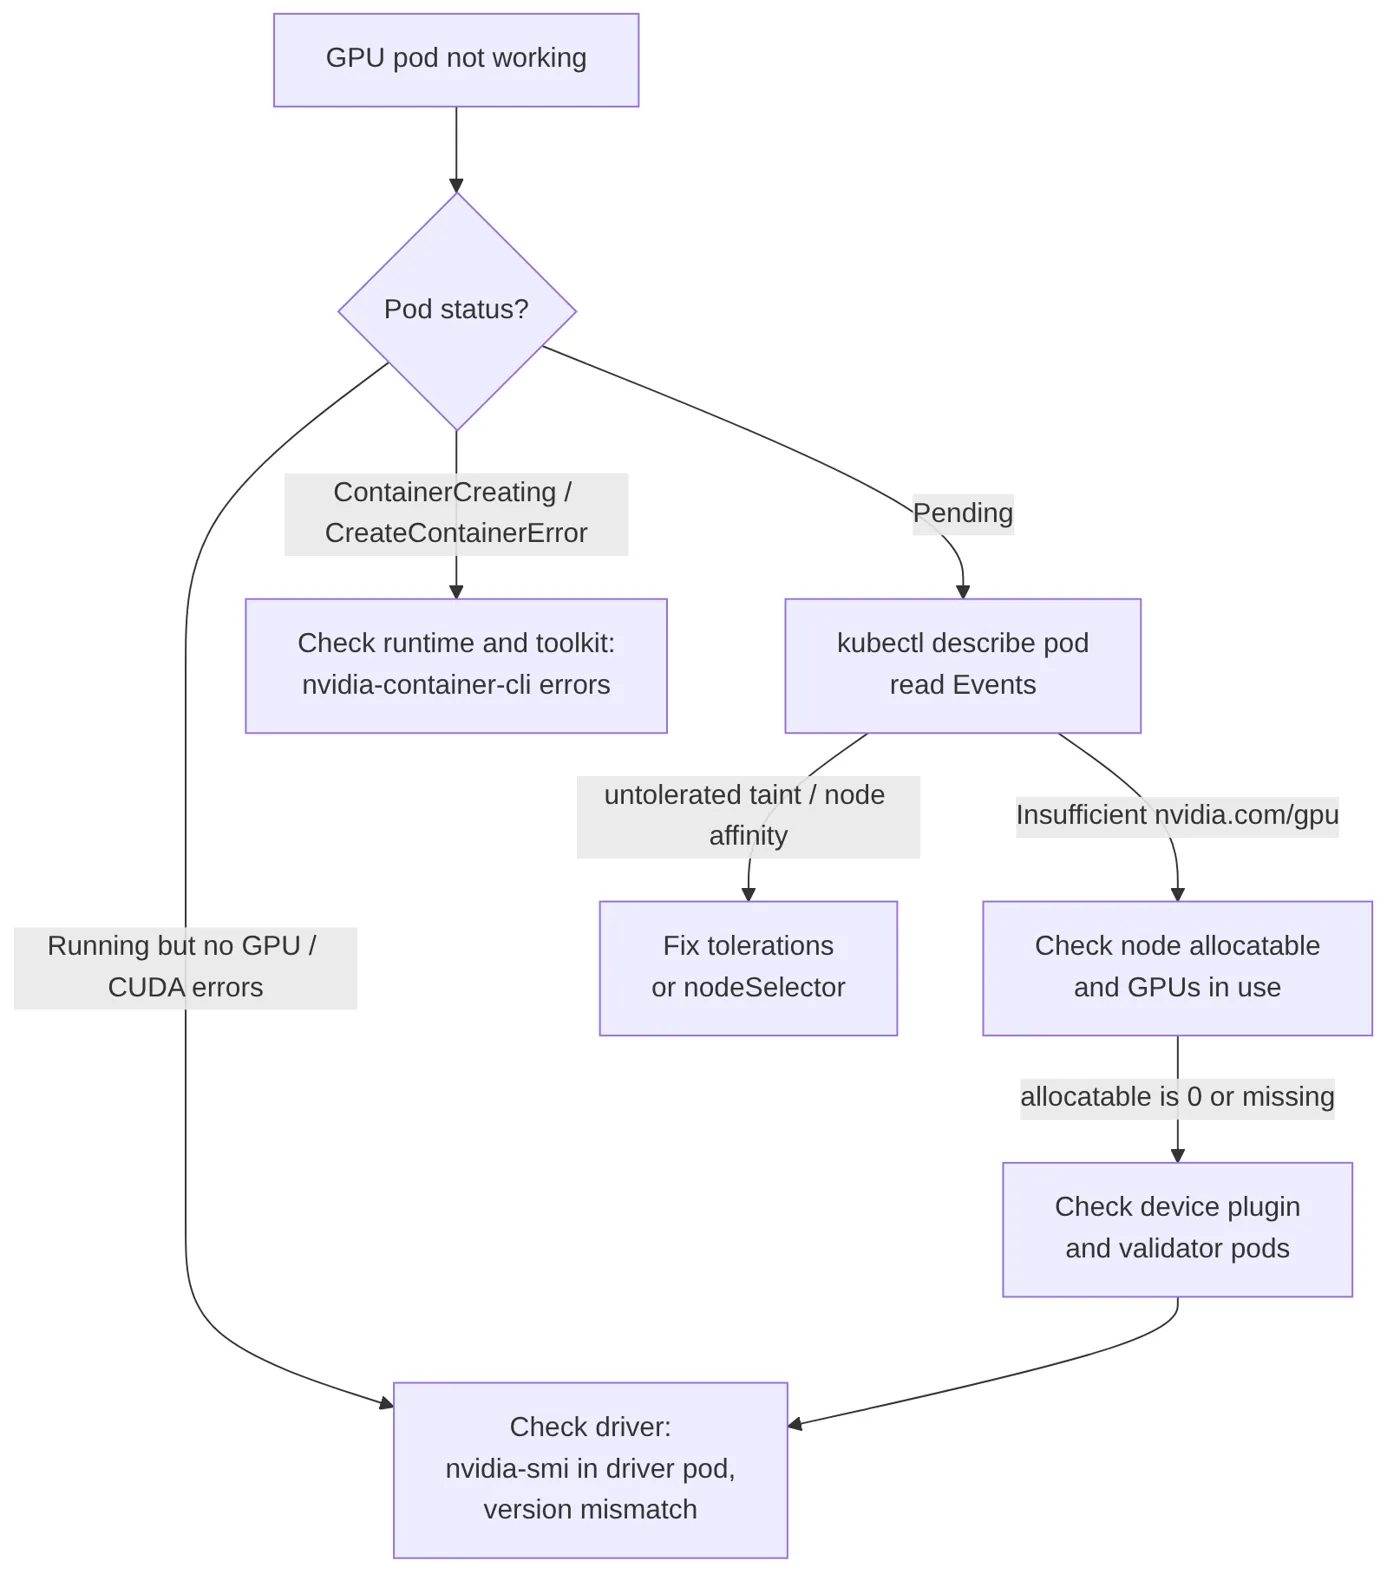
Troubleshooting flowchart for Kubernetes GPU pods, starting from pod status and moving through scheduler events, node allocatable resources, device plugin, container runtime, and NVIDIA driver checks.
1. Pod stuck in Pending: insufficient GPU
kubectl describe pod <pod> | sed -n '/Events/,$p'
Typical message:
0/4 nodes are available: 1 Insufficient nvidia.com/gpu, 3 node(s) didn't match Pod's node affinity/selector.
Find which pods are holding GPUs:
kubectl get pods -A -o json | jq -r '.items[]
  | select(.status.phase=="Running")
  | select([.spec.containers[].resources.limits["nvidia.com/gpu"] // empty] | length > 0)
  | "\(.metadata.namespace)/\(.metadata.name) on \(.spec.nodeName)"'

kubectl describe node <gpu-node> | grep -A8 "Allocated resources"
Common causes: every GPU is already taken (often by a forgotten notebook or a finished Job whose pod was never cleaned up), a rolling update needs a second GPU on a single-GPU node, or your nodeSelector names a GPU product label that does not exist (for example NVIDIA-L4 vs NVIDIA-L4-SHARED after enabling time-slicing).
2. Node shows no nvidia.com/gpu at all
kubectl get node <gpu-node> -o jsonpath='{.status.allocatable}' | jq
kubectl get pods -n gpu-operator -o wide --field-selector spec.nodeName=<gpu-node>
kubectl logs -n gpu-operator -l app=nvidia-device-plugin-daemonset --tail=50
If nvidia.com/gpu is missing, the device plugin has not registered. Look at the validator first, since the Operator holds later components until earlier ones pass:
kubectl logs -n gpu-operator -l app=nvidia-operator-validator --all-containers --tail=50
Init containers named for each stage (driver, toolkit, cuda, plugin) show which step failed.
3. Driver problems and version mismatch
kubectl logs -n gpu-operator ds/nvidia-driver-daemonset --tail=100
kubectl exec -n gpu-operator ds/nvidia-driver-daemonset -- nvidia-smi
Patterns to recognize:
Failed to initialize NVML: Driver/library version mismatch: the user-space libraries and the loaded kernel module are different versions. Usually caused by a host package upgrade, or by a host-installed driver fighting the Operator-managed one. Pick one owner for the driver and reboot the node.- Driver pod in
CrashLoopBackOffafter a kernel update: the driver container cannot build or find modules for the new kernel. Check that your driver version supports the node’s kernel and OS, or use precompiled driver images where available. - Secure Boot enabled: unsigned kernel modules will not load. Use signed drivers or follow your distribution’s guidance.
4. Container runtime and toolkit errors
Pattern: pod in CreateContainerError or RunContainerError with an event mentioning nvidia-container-cli, for example:
nvidia-container-cli: initialization error: nvml error: driver not loaded
That means the toolkit hook ran but the driver was not ready. Check the driver pod first, then the toolkit pod logs:
kubectl logs -n gpu-operator -l app=nvidia-container-toolkit-daemonset --tail=50
On nodes where you installed the toolkit yourself, check that the runtime config was updated and the runtime restarted (nvidia-ctk runtime configure --runtime=containerd, then restart containerd).
5. Pod runs but the app sees no GPU
Inside the container:
kubectl exec <pod> -- nvidia-smi -L
kubectl exec <pod> -- printenv | grep -i nvidia
If nvidia-smi is missing or lists nothing, the pod probably did not request nvidia.com/gpu (setting NVIDIA_VISIBLE_DEVICES by hand is not a substitute and can bypass the scheduler). If nvidia-smi works but your framework says “no CUDA device”, the image’s CUDA version is likely newer than the node driver supports. Compare the CUDA Version shown by nvidia-smi with what your image was built for.
6. MIG layout stuck
kubectl get node <gpu-node> -o jsonpath='{.metadata.labels.nvidia\.com/mig\.config\.state}'
kubectl logs -n gpu-operator -l app=nvidia-mig-manager --tail=100
A failed state usually means the profile name is not valid for that GPU model, or GPU processes outside Kubernetes were holding the device.
GPU cost optimization
There are no universal savings numbers here, because results depend entirely on your workload mix. These are the levers, in the order most teams should pull them:
- Measure first. Use the “GPU utilization by namespace” query above and the idle-GPU alert. You cannot fix what you cannot see, and most teams are surprised by how many allocated GPUs sit near zero.
- Right-size the request. Does a 7B model really need an 80 GB GPU? Often a smaller GPU type or a MIG slice serves it fine. Use GFD labels to route workloads to the cheapest GPU that fits.
- Share where isolation allows. Time-slicing for dev and CI, MIG for multi-tenant inference.
- Bin-pack GPU nodes. The default scheduler spreads pods. For GPU node pools, a scheduler profile with
MostAllocatedscoring (or a batch scheduler like KAI Scheduler or Volcano) fills nodes before starting new ones, which lets the autoscaler remove empty nodes. - Scale to zero where you can. Batch and internal tools can use KEDA to scale to zero, plus a node autoscaler that removes empty GPU nodes. Keep warm capacity for user-facing inference because cold starts are long.
- Kill idle work. Set
activeDeadlineSecondsorttlSecondsAfterFinishedon Jobs, and have a policy for idle notebooks. - Use spot or preemptible GPUs for interruptible work. Training with checkpoints and batch inference handle interruption well. Online serving usually does not.
- Queue instead of over-provisioning. Kueue lets teams submit GPU jobs against quotas and wait their turn, instead of every team keeping its own idle buffer.
Production best practices and readiness checklist
Security and isolation
- The Operator namespace runs privileged pods. Restrict who can deploy there with RBAC, and keep workload namespaces at
baselineorrestrictedPod Security levels. - Never give workloads
privileged: trueor host device mounts to “fix” GPU access. Requestnvidia.com/gpuand let the device plugin and CDI inject the devices. - Time-slicing has no memory isolation. Do not use it between tenants who should not affect each other. Use MIG or separate GPUs.
- Pull model weights from a trusted source and scan your inference images. Store Hugging Face tokens in Secrets (or an external secret manager), not in images or args.
Quotas and scheduling policy
Limit GPUs per namespace with a ResourceQuota on the extended resource:
apiVersion: v1
kind: ResourceQuota
metadata:
  name: gpu-quota
  namespace: team-a
spec:
  hard:
    requests.nvidia.com/gpu: "4"
Add PriorityClasses so production inference can preempt dev work, and consider Kueue or KAI Scheduler when you need fair sharing, gang scheduling for multi-GPU training, or queues.
Upgrades and reliability
- Upgrade the GPU Operator with a pinned
--version, one minor version at a time, and read the release notes for removed options. - Driver upgrades restart GPU pods on the node. Roll them through node pools gradually and use PodDisruptionBudgets on inference Deployments.
- Keep GPU node images, kernels and drivers on a tested combination. Unplanned kernel updates are a common cause of driver failures.
- Watch XID errors and remapped rows, and have a runbook for draining and resetting a faulty GPU node.
Production-readiness checklist
- ☐ Kubernetes version is in support and matches the GPU Operator platform support list
- ☐ GPU Operator installed with a pinned version; values file stored in Git
- ☐ Exactly one owner for the NVIDIA driver on each node (host or Operator, not both)
- ☐
nvidia-cuda-validatorcompletes on every GPU node - ☐ GPU nodes tainted; GPU workloads have matching tolerations
- ☐ Workloads target GPU types with GFD labels, not node names
- ☐ Sharing strategy chosen per node pool and documented (exclusive, MIG, time-slicing)
- ☐ ResourceQuota on
requests.nvidia.com/gpufor every team namespace - ☐ PriorityClasses defined for production vs dev GPU work
- ☐ DCGM metrics scraped by Prometheus, Grafana dashboard in place
- ☐ Alerts for temperature, memory, XID errors and idle allocated GPUs
- ☐ Inference images and model versions pinned; startup probes sized for model load
- ☐ Model weights cached on persistent storage or a pre-pulled image
- ☐ PodDisruptionBudgets on inference services; upgrade runbook tested
- ☐ Autoscaling signal based on queue depth or latency, not CPU
Frequently asked questions
How do I check if my Kubernetes node has a GPU?
Run kubectl describe node <node> and look for nvidia.com/gpu under Capacity and Allocatable. If it is missing, the device plugin is not running or not registered on that node.
Can multiple pods share one GPU in Kubernetes?
Not by default. Each nvidia.com/gpu goes to one container. You can share a GPU with NVIDIA MIG (hardware isolation, supported GPUs only), time-slicing (no isolation), or MPS (experimental). DRA also supports sharing configurations.
Can I request half a GPU, like nvidia.com/gpu: 0.5?
No. Extended resources must be whole numbers. To get a fraction, configure MIG and request a slice such as nvidia.com/mig-1g.10gb: 1, or enable time-slicing so one GPU is advertised as several replicas.
What is the difference between MIG and time-slicing?
MIG splits the GPU in hardware: each slice gets its own memory and compute, and faults stay contained. Time-slicing lets pods take turns on the whole GPU with shared memory and no fault isolation. MIG needs Ampere or newer GPUs that support it; time-slicing works on most NVIDIA GPUs.
Do I need the NVIDIA GPU Operator, or is the device plugin enough?
The device plugin alone works if you already manage drivers and the container toolkit on every node. The Operator automates the driver, toolkit, device plugin, feature discovery, MIG Manager, and DCGM Exporter, which is easier to keep consistent across many nodes.
Should I use Dynamic Resource Allocation (DRA) instead of the device plugin?
DRA is GA in Kubernetes 1.34 and is the long-term direction, with richer device selection. The device plugin is still more widely documented and supported by default on managed services. Use DRA for new clusters where you need attribute-based selection, after testing; parts of NVIDIA’s DRA sharing features are still alpha.
Why is my GPU pod stuck in Pending?
Run kubectl describe pod and read Events. Insufficient nvidia.com/gpu means no node has a free GPU. Taint or selector messages mean your tolerations or nodeSelector do not match. If no node shows nvidia.com/gpu at all, check the device plugin and validator pods.
Why does nvidia-smi work but PyTorch cannot find CUDA?
Usually the image was built for a newer CUDA version than the node driver supports. Compare the CUDA Version in nvidia-smi output with your image’s CUDA version, and upgrade the driver or use an older image.
How do I monitor GPU usage in Kubernetes?
Use NVIDIA DCGM Exporter, which the GPU Operator installs by default. It exposes metrics such as DCGM_FI_DEV_GPU_UTIL and DCGM_FI_DEV_FB_USED on port 9400. Scrape it with Prometheus and visualize with the Grafana dashboard 12219.
How do I run an LLM on Kubernetes?
Deploy an inference server such as vLLM as a Deployment that requests nvidia.com/gpu, mount a persistent volume for model weights, add a shared memory volume, and use a startup probe long enough for model loading. Expose it with a Service and test the OpenAI-compatible /v1/chat/completions endpoint.
How do I autoscale GPU inference workloads?
Scale pods on inference signals such as request queue depth (vLLM exposes vllm:num_requests_waiting) using KEDA or the Prometheus Adapter, and scale GPU nodes with Cluster Autoscaler or Karpenter. Keep a warm replica because GPU node and model startup take minutes.
How do I limit how many GPUs a team can use?
Create a ResourceQuota in the team’s namespace with requests.nvidia.com/gpu set to the limit. For queues and fair sharing across teams, add Kueue or a batch scheduler such as KAI Scheduler.
Does time-slicing affect GPU monitoring?
Yes. With time-slicing enabled, DCGM Exporter cannot associate metrics with individual containers, so you only get per-GPU metrics. MIG and exclusive allocation keep per-pod attribution.
Verify it yourself
Because this guide was not executed on GPU hardware, here is the shortest path to confirm it on yours:
- Run Steps 1 to 5 of the GPU Operator setup and confirm
Test PASSEDfrom the CUDA vector add pod. - Apply
gpu-pod.yamland confirmnvidia-smioutput. - Run the vLLM lab and confirm a chat completion response.
- Query
DCGM_FI_DEV_GPU_UTILin Prometheus while the vLLM pod handles requests.
If any step differs from the expected pattern, the troubleshooting section maps the symptom to the layer that failed.
References
- Kubernetes: Schedule GPUs
- Kubernetes blog: Kubernetes v1.34: DRA has graduated to GA
- NVIDIA: GPU Operator installation
- NVIDIA: GPU Operator release notes
- NVIDIA: GPU Operator with MIG
- NVIDIA: Time-slicing GPUs in Kubernetes
- NVIDIA: k8s-device-plugin repository
- NVIDIA: DCGM Exporter repository and default counters
- Kubernetes SIGs: NVIDIA DRA driver for GPUs
- vLLM: Deploying with Kubernetes and releases
- Grafana: NVIDIA DCGM Exporter dashboard