Profiling LLM Inference with SGLang and Torch Profiler
This blog is my attempt to learn how to profile an llm served using sglang and its in built torch profiler integration that comes out of box...
📝 摘要
本文详细介绍了如何使用 SGLang 内置的 Torch Profiler 集成来剖析 LLM 推理过程,以 Qwen3.5-0.8B 在单张 NVIDIA L4 GPU 上的运行为例,从 CPU 和 GPU 两个视角解析 prefill 和 decode 阶段的性能瓶颈。作者首先通过 roofline 模型估算 batch size 1 decode 场景下带宽受限(187.5 tokens/s)远低于计算上限(75k tokens/s),预判推理为内存带宽瓶颈。随后通过 Perfetto 可视化 trace 文件,揭示 prefill 阶段的重复峰值模式与模型混合架构(6 组 × 3 Gated DeltaNet + 1 Attention)完美对应,以及 vocab 投影层(248k 维度)的 GEMV kernel 成为最耗时操作。Decode 阶段使用 CUDA Graph Replay,大量线性层退化为瘦 GEMV 操作,导致内存带宽受限而非计算受限,解释了单请求 decode 性能难以提升的根本原因。
核心概念: LLM 推理的 decode 阶段在 batch size 1 时是内存带宽受限的(GEMV 主导),而非计算受限(GEMM 主导);增加 batch size 可使部分操作从 GEMV 向 GEMM 转化,从而更好利用 GPU 算力。
关键技术栈 / 关键要点:
- Roofline 模型分析 — 推理前先做带宽/计算上限估算,预判瓶颈类型(本例带宽 187.5 tokens/s vs 计算 75k tokens/s)
- SGLang Profiler 集成 — 通过
/start_profile端点按 step 采集 CPU+GPU 活动,支持按 prefill/decode 分离 trace - 混合架构峰值模式 — Qwen3.5 的 Gated DeltaNet + Attention 混合层结构在 profiler trace 中呈现可识别的重复峰值模式
- Vocab 投影瓶颈 — 248k 大词表的线性投影是 prefill 中最慢的单次 kernel,GEMV 操作 [1,1024]@[1024,248320]
- Decode 的 CUDA Graph Replay — SGLang decode 路径使用 CUDA Graph 捕获重放,CPU 端不再逐层启动,GPU 端 kernel 在 graph replay 下可见
- GEMV vs GEMM 本质差异 — decode 阶段大量线性层退化为瘦 GEMV,算术强度低,权重从内存流式读取但无法充分复用 Tensor Core,导致内存带宽瓶颈
关键结论 / 实践建议: Profile LLM 推理时应先理解模型架构再做 trace 分析,kernel 名称噪声大但结合数据流可大幅提升可读性;单请求 decode 的性能天花板由内存带宽决定,增加 batch size 是改善 GEMV→GEMM 转化比的关键手段。
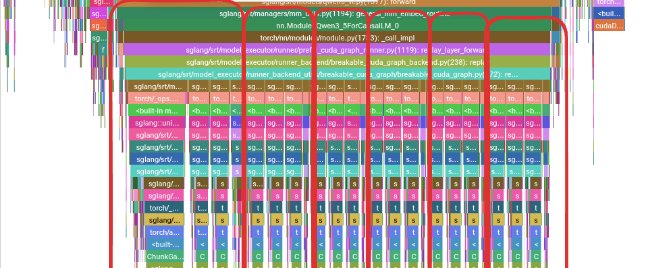
This blog is my attempt to learn how to profile an llm served using sglang and its in built torch profiler integration that comes out of box. The idea here would be try and understand when I hit sglang serve on my command prompt, can I recognize the CPU side and GPU side events and understand the question "where is most of my time and compute going?"
For this first of many blogs, im using Qwen3.5-0.8B on a single NVIDIA L4 GPU, so a lot of people with lesser compute can also profile and follow along. Besides being a small model, it also has a lot of the newer architecture designs and makes the trace still readable.
Understanding the Model First
Before opening the profiler, it helps to know what patterns/layers we expect to see. Make sure you understand the model very well. For this run, the important model stats are
parameters - 0.8B
hidden dim - 1024
embedding dim - 248k
layers - 24
a pattern of 6 groups of 3 x (Gated DeltaNet + FFN) followed by 1 x (Gated Attention + FFN)
context length - 262k tokens
this means using bf16, the weights take about -
0.8B parameters * 2 bytes = 1.6 GB
For batch size 1 decode, we can do a basic math roofline check to understand what kind of bottleneck to expect.
memory bandwidth for my gpu = 300 GB/s
weights to move per token = 1.6 GB
bandwidth limited throughput = 300 / 1.6
                             = 187.5 tokens/s

For compute, a very rough inference estimate is around 2P FLOPs per token.
FLOPs/token = 2 * 0.8B = 1.6 GFLOPs
bf16 tensor throughput ~ 121 TFLOP/s

compute-limited throughput = 121000 / 1.6
                           = 75k tokens/s
The compute roof is way higher than the bandwidth roof. So before looking at any trace, my starting assumption is that for batch size 1 decode, this workload is going to be much closer to memory bound than compute bound. The profiler should either confirm that or explain why that mental model is wrong.
Setup
apt-get update
apt-get install -y cuda-toolkit-13-2

uv venv
source .venv/bin/activate
uv pip install --prerelease=allow sglang

sglang serve --model-path Qwen/Qwen3.5-0.8B
Now we make use of the profiling endpoint to record CPU and GPU activities and seperate the prefill and decode into two traces so its easier to read.
Here I say wait for 5 steps (warmup), then profile the next 2 steps. The profiler captures two forward passes during decode.
curl -X POST http://127.0.0.1:30000/start\_profile \ -H "Content-Type: application/json" \ -d '{ "output_dir": "/workspace/traces", "start_step": 5, "num_steps": 2, "activities": ["CPU", "GPU"], "profile_by_stage": true, "record_shapes": true, "with_stack": true }'
Then I sent a single request with the serving benchmark
python -m sglang.bench_serving --backend sglang --num-prompts 1
By the way something to keep in mind, CUDA launches are asynchronous. This means the CPU timeline can show a kernel launch earlier, while the actual kernel runs later on the GPU lane and this intially tripped me up a lot. So when reading the trace, I mostly stuck to reading the CPU side first to understand who launched the work, and the GPU side to understand where the device time went.
To view the traces, open Perfetto UI and load the trace files generated after profiling.
Prefill Section
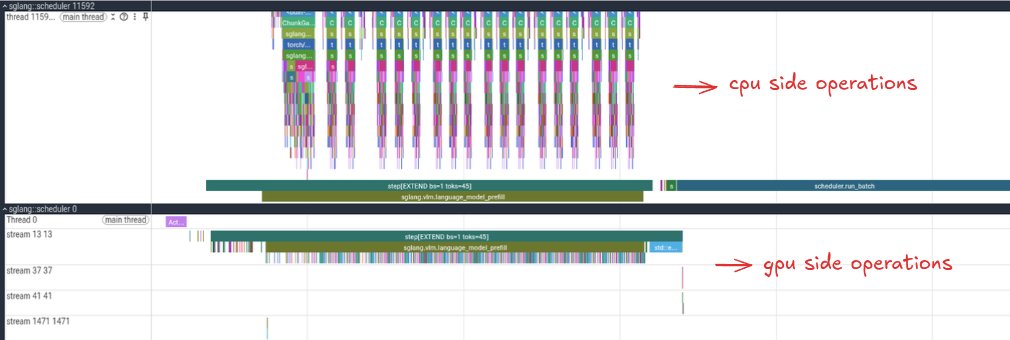
Prefill section for a single request.
This is the full prefill region for our single request. Prefill is the phase where the model consumes the prompt tokens and produces a single token. The top half of the profiler has the CPU side operations and lower half is the GPU side operations.
Are you able to spot your first pattern? The peaks seem to be grouped into 3 with a smaller peak in between. Another striking thing is the first peak being way bigger compared to the others. Keep this in mind and we will unravel each feature as we progress in the blog.
Cool, if you scroll into the tinier peak to the left most side and zoom in a bit, you will see a lot of setup work. This includes starting the torch profiler, sglang getting ready to prepare the batch of inputs, setting up CUDA streams everything lining up to run the forward pass.
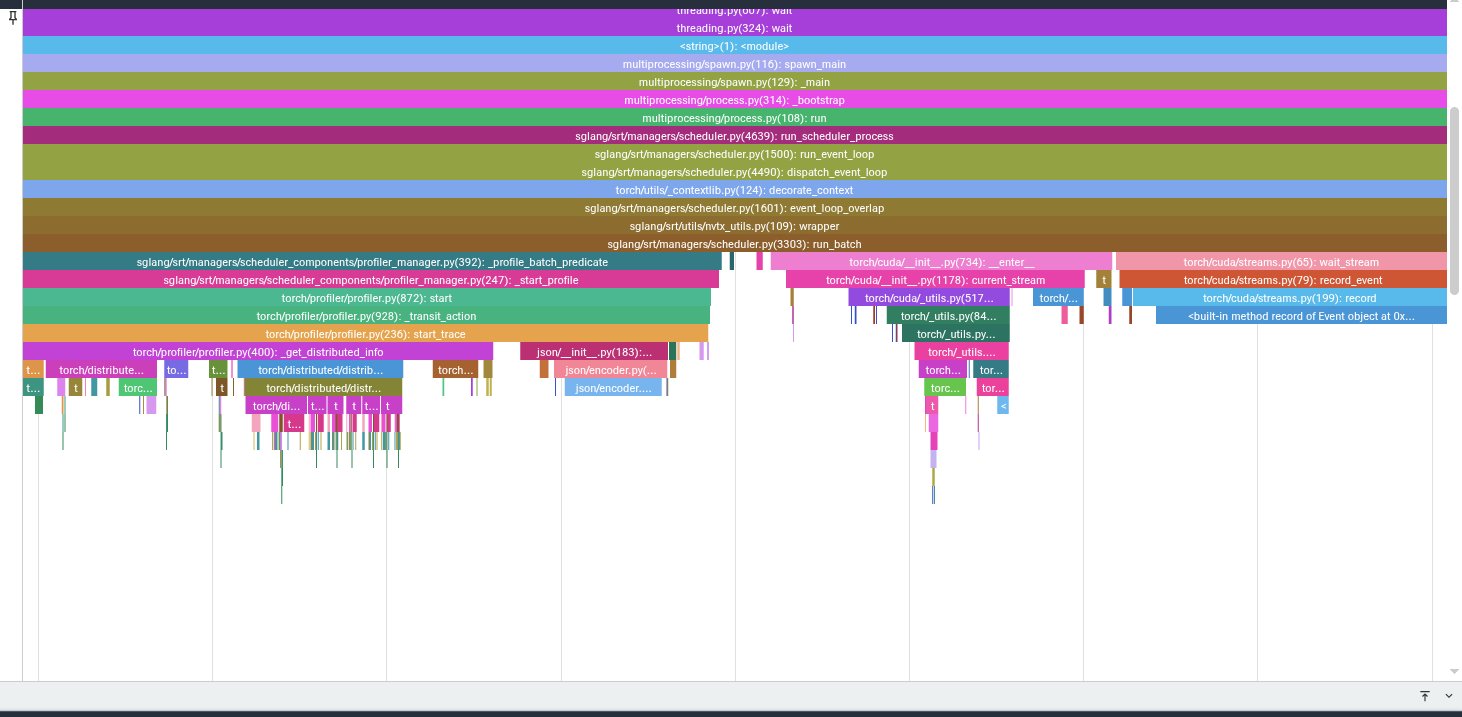
The scheduler prepares the request, starts profiling, sets streams, and builds the batch.
Another cool thing you can do is if you want to know the kernel a particular cpu activity launched, you can click on the operation and it will link you to the exact kernel it launched with some information.
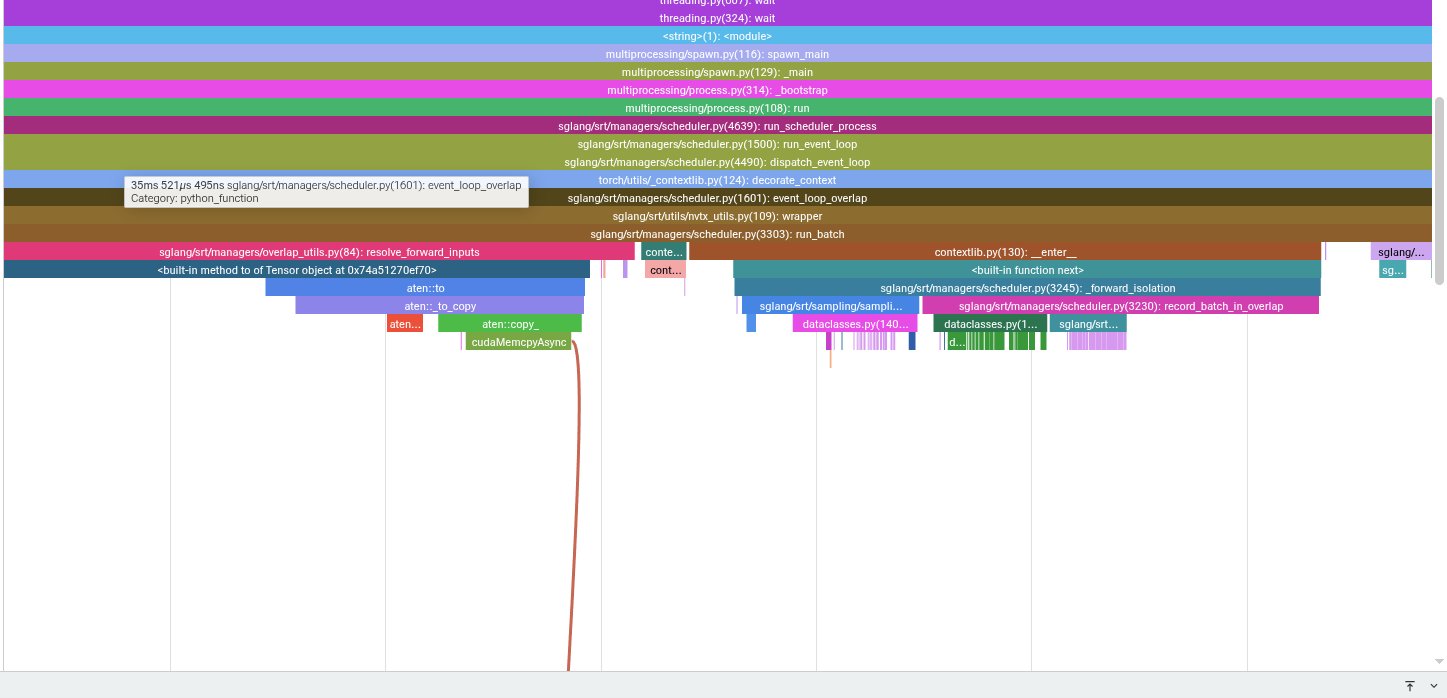
A small async copy linked back to the CPU-side launch.
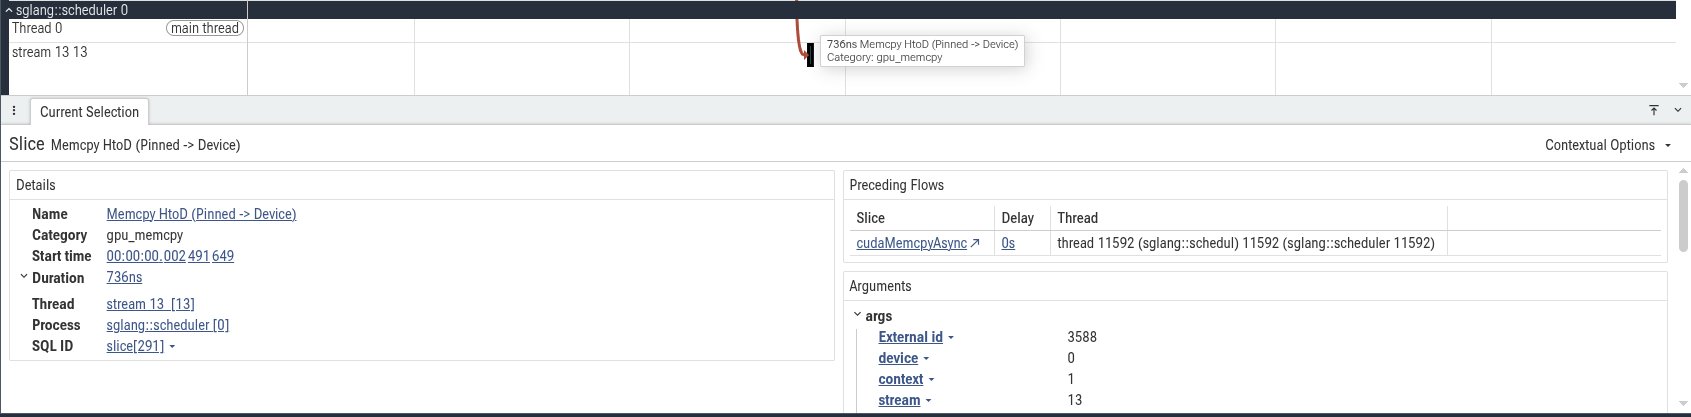
The host-to-device copy is tiny, probably token ids or request metadata.
In this case, we can see a host-to-device copy from pinned CPU memory to the GPU. For this run it is probably request metadata, token ids, or some small tensor needed by the scheduler.
Pattern 1 - The Repeating Peaks
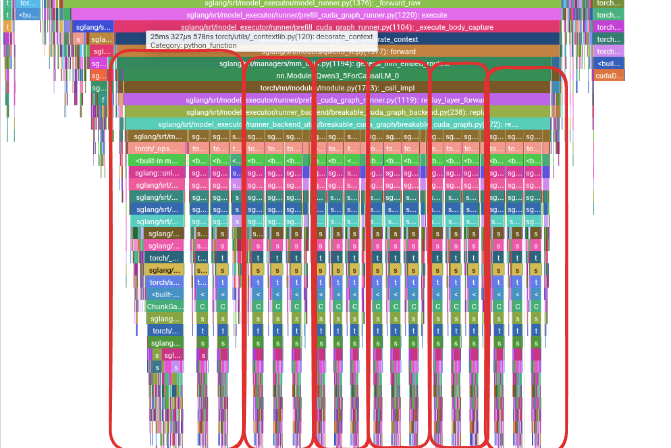
The main prefill compute region. The peaks appear in repeating groups.
Now we are inside the main prefill compute region. Remember from the zoomed out view we had these repeating peaks but they appear in groups. Well, these peaks are not random and if you remember the model architecture, these peaks matches exactly the group structure we had.
To jog your memory a bit, Qwen3.5-0.8B has 6 repeated groups. Each group has 3 Gated DeltaNet blocks followed by 1 full-attention block. So in the profiler, I expect to see something like -
[GDN + FFN] [GDN + FFN] [GDN + FFN] [Attention + FFN]
[GDN + FFN] [GDN + FFN] [GDN + FFN] [Attention + FFN]
... repeated 6 times
Now, let's zoom into the first peak and see what operations are going on in there.
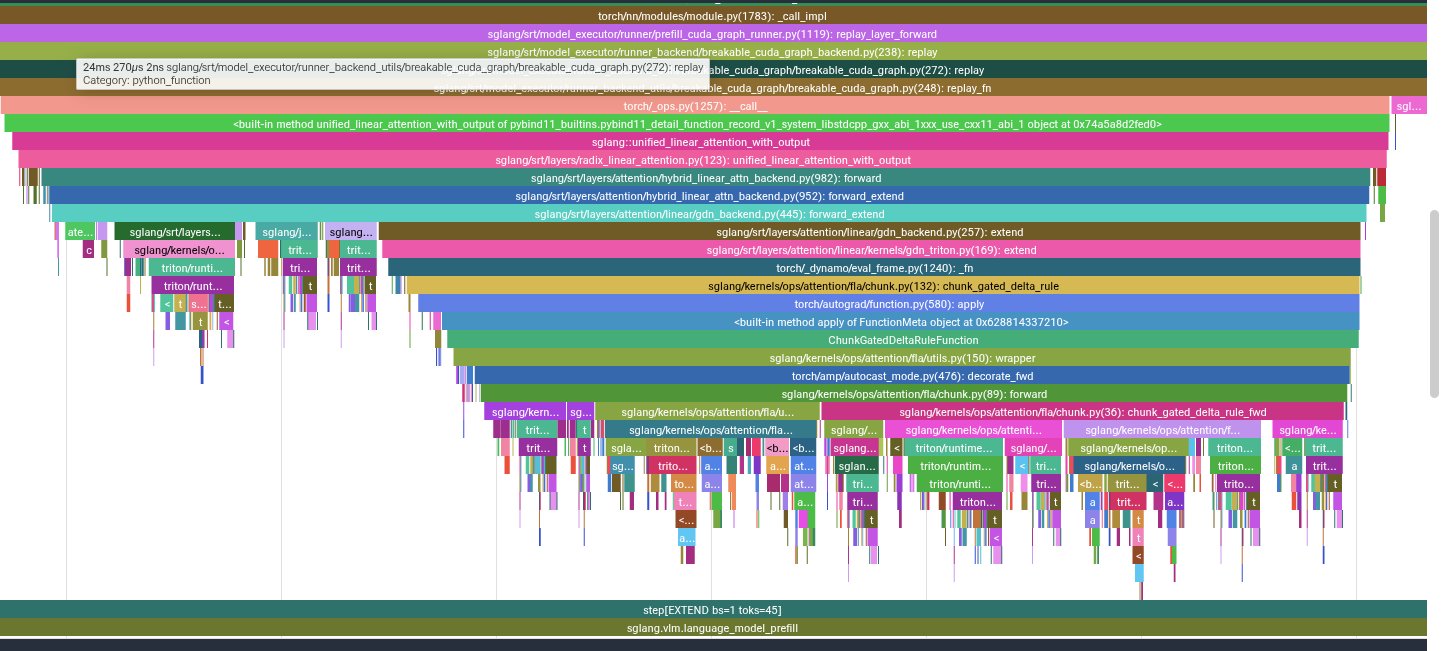
The first peak is a little larger because it includes extra setup and indexing/copy work.
Why do I think the first peak in the first group is way larger than the others? My assumption is going to be that the first hybrid block usually has some extra setup cost compared to the other blocks.
Now scroll onto the next 2 peaks and the smaller peak within the first group.
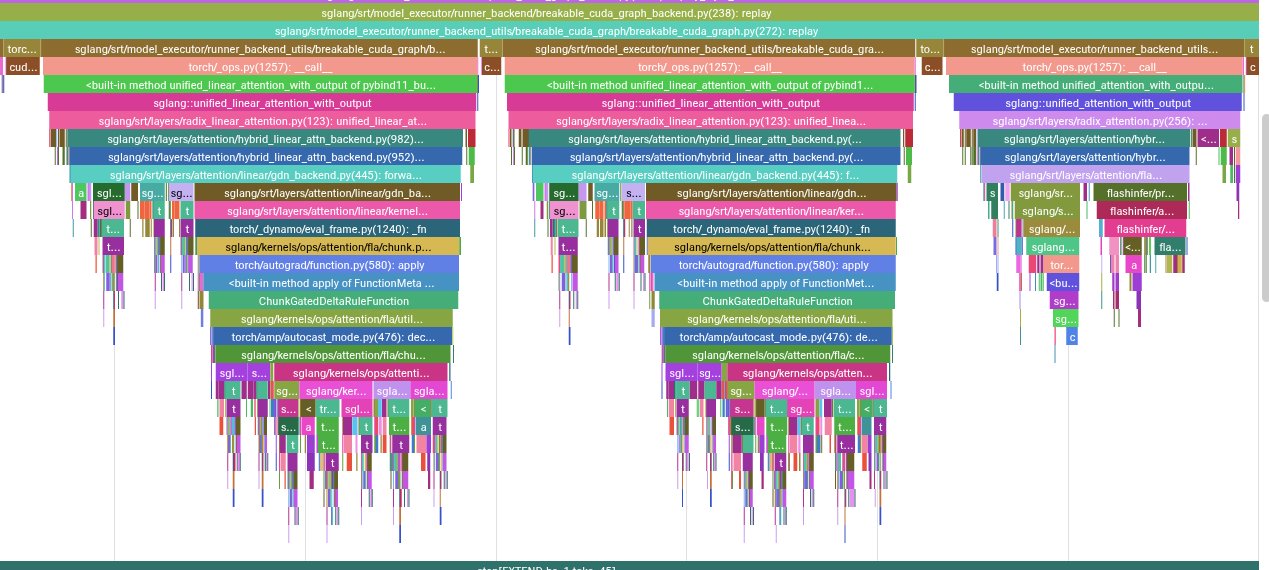
The next peaks line up with GDN blocks and the smaller full-attention block.
These are the GDN blocks including kernels like -
causal_conv1d_fn
fused_qkv_split_gdn_prefill
fused_gdn_gating
ChunkGatedDeltaRuleFunction
l2norm_fwd
chunk_local_cumsum
chunk_gated_delta_rule_fwd_kkt_solve
recompute_w_u_fwd
chunk_gated_delta_rule_fwd_h
chunk_fwd_kernel_o
You can also verify this by clicking on the kernels in the GPU section
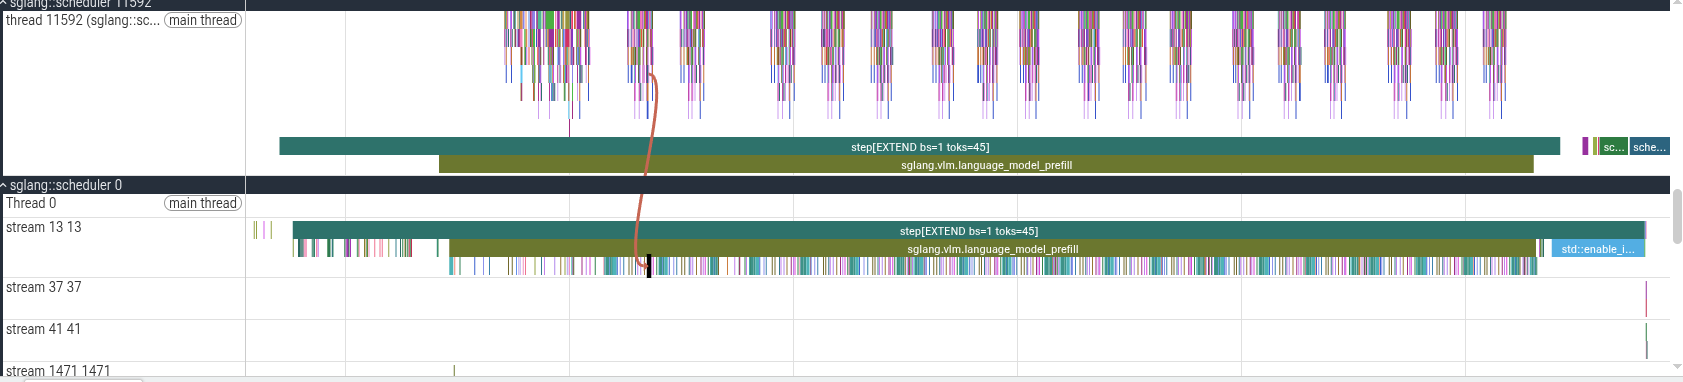
prefill side kernels
The smaller fourth peak is the full-attention block which uses FlashInfer. For this short prompt of 45 tokens, full attention is not actually the bottleneck.
Pattern alert! From the kernels section, we have repeating green thick sections and towards the end a final big blue kernel. Keep this mind for the next section.
The Final Vocab Projection
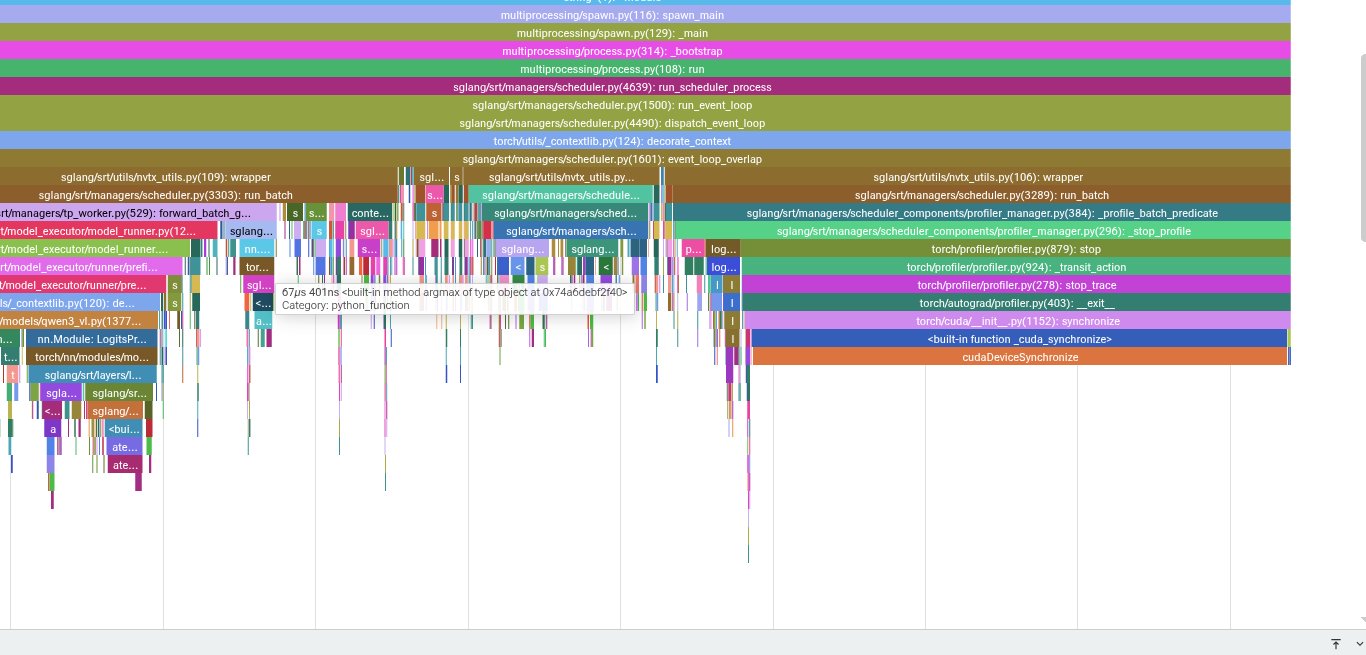
After the layer stack, SGLang prepares decode and computes logits for sampling.
If you push past the whole repeating peaks into the final section, the server moves into cleanup and prepares for decode. This includes the final projection to logits, sampling, and copying the result back to CPU. This section is easy to ignore, but in this trace the logits processor contains one of the most expensive kernels.
If you click the CPU side aten::mm and expand the args, PyTorch shows:
Input type: ['c10::BFloat16', 'c10::BFloat16'] Input strides: [[1024, 1], [1, 1024]] Input dims: [[1, 1024], [1024, 248320]]
Conceptually, this is:[1, 1024] @ [1024, 248320] = [1, 248320]
Since the vocab size is huge, this turns into a large matrix vector style projection. Even though it runs only once during prefill for this prompt, it is still one of the slowest kernels in the section.
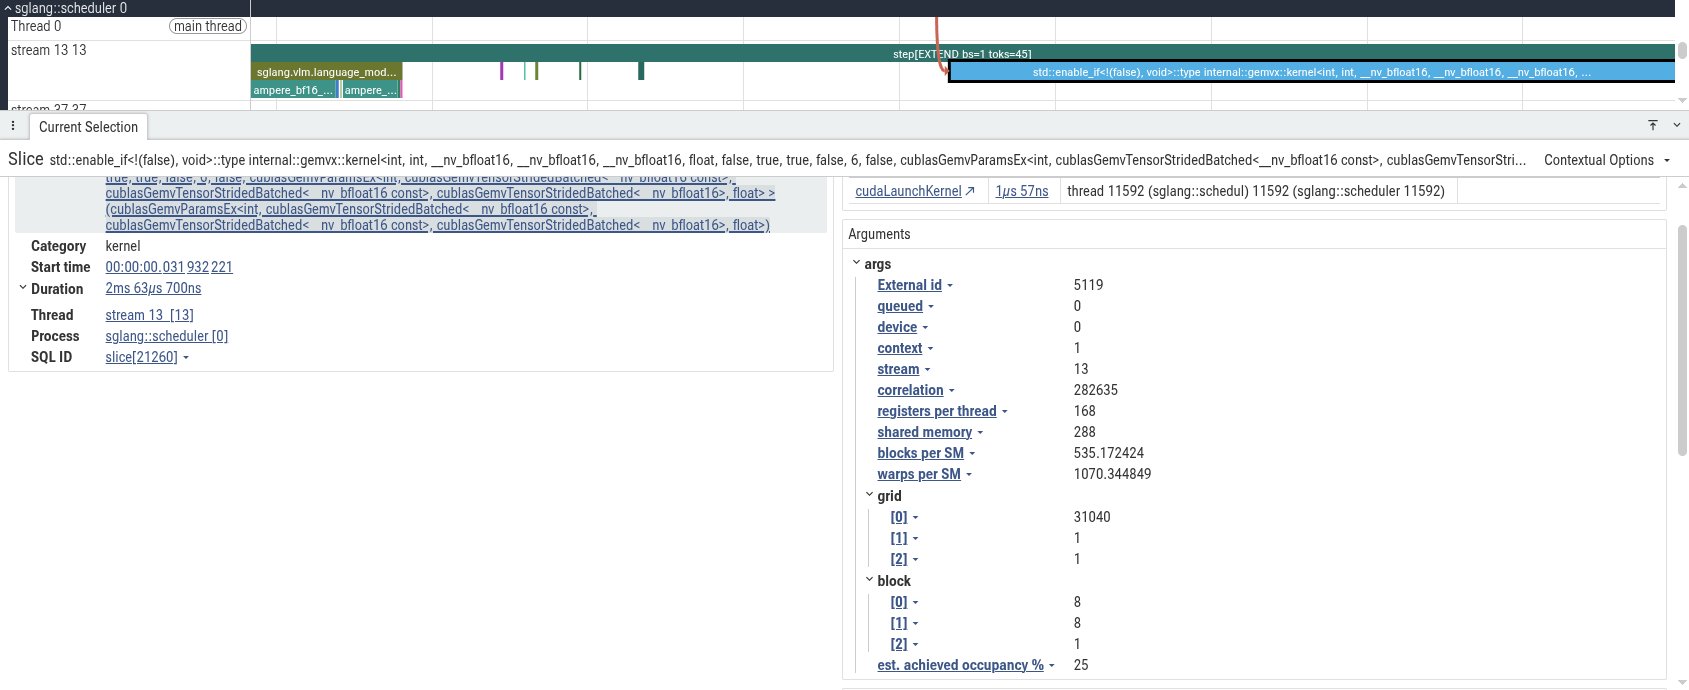
The vocab projection kernel details.
The kernel details are also quite useful to read (you can do more with Nsight)
grid: [31040, 1, 1] block: [8, 8, 1] registers/thread: 168 shared memory: 288 occupancy: 25%
What's this grid shape? 248320 vocab elements / 8 = 31040
Cool, the final linear head is projecting one 1024 wide hidden vector across a very large vocab dimension. If I were optimizing this path, I would look closely at whether this projection can be fused or look for similar optimizations.
Top Prefill Kernels
Now let's look at the most prominent kernels that are running in this workload.
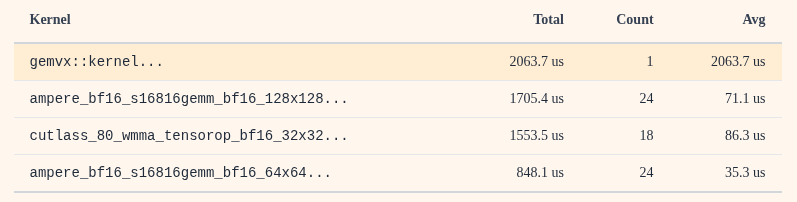
The final gemv kernel is indeed the most expensive despite being invoked only a single time. The 128x128 BF16 GEMM appears 24 times, which lines up with one large projection-style operation per block. The smaller CUTLASS BF16 GEMM appears 18 times, which lines up nicely with the 18 GDN blocks.
Kernel names alone can be quite noisy and hard to understand sometimes, so understanding the model layout and data flow together can make the trace much easier to reason about.
Decode Phase
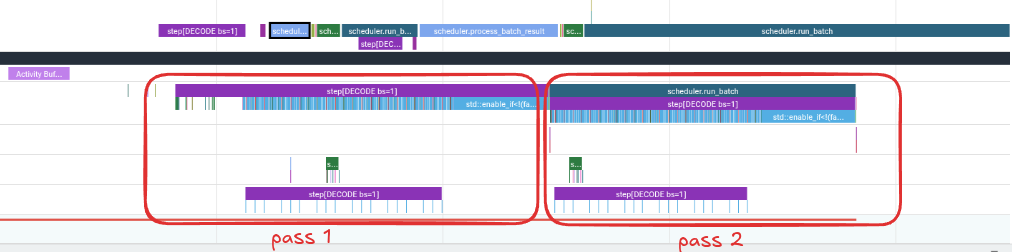
📷The decode region. Since I profiled two steps, there are two decode passes.
Decode is a different workload compared to prefill. During prefill, the model processes the entire prompt sequence so many operations have enough work to become decent GEMMs. But during decode with smaller batch sizees, the model is mostly processing one new token at a time and a lot of projection work collapses into skinny matrix vector operations.
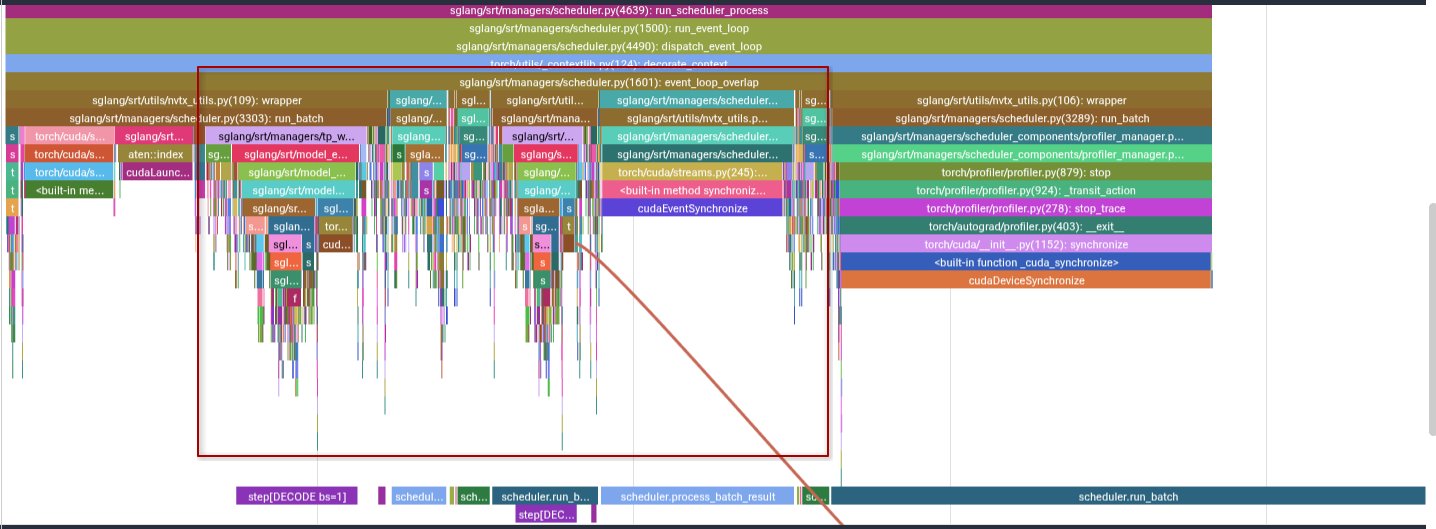
The highlighted region is the decode compute path to focus on.
In this trace, the highlighted region is the important part. The surrounding regions is mostly profiler setup/shutdown, input setup, synchronization, and bookkeeping. Those are worth understanding, but they are not the main model compute path.
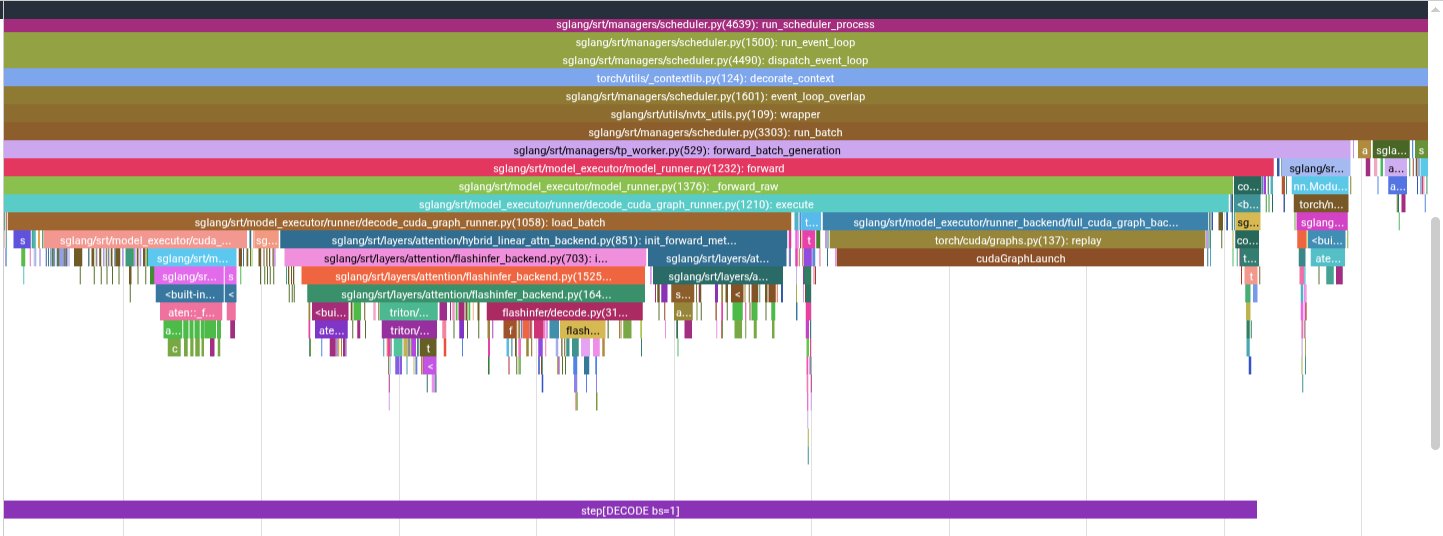
The first decode step, zoomed into CPU-side execution.
On the left, SGLang loads the batch and copies this decode step's inputs into fixed CUDA graph buffers. In the middle is where the actual decode work happens. Suprise surprise! Unlike prefill, the CPU timeline does not show every model layer as a deep stack of individual launches, because the decode path is using CUDA graph replay.
Before the graph replay, there are a few small kernels and copies for setup. These are not the layer stack. They are mostly preparing the fixed buffers and execution state needed by the captured graph.
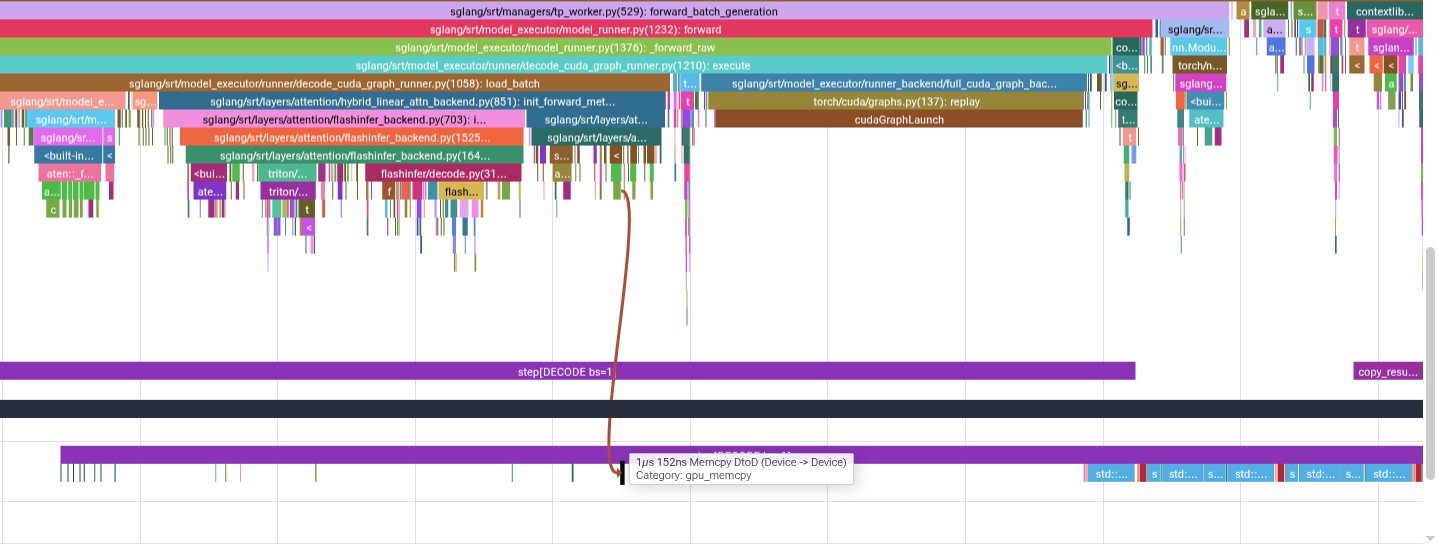
A few setup kernels run before the graph replay.
Once you click into the graph replay region, the GPU kernels become visible under that replay. This is the view that matters for decode.
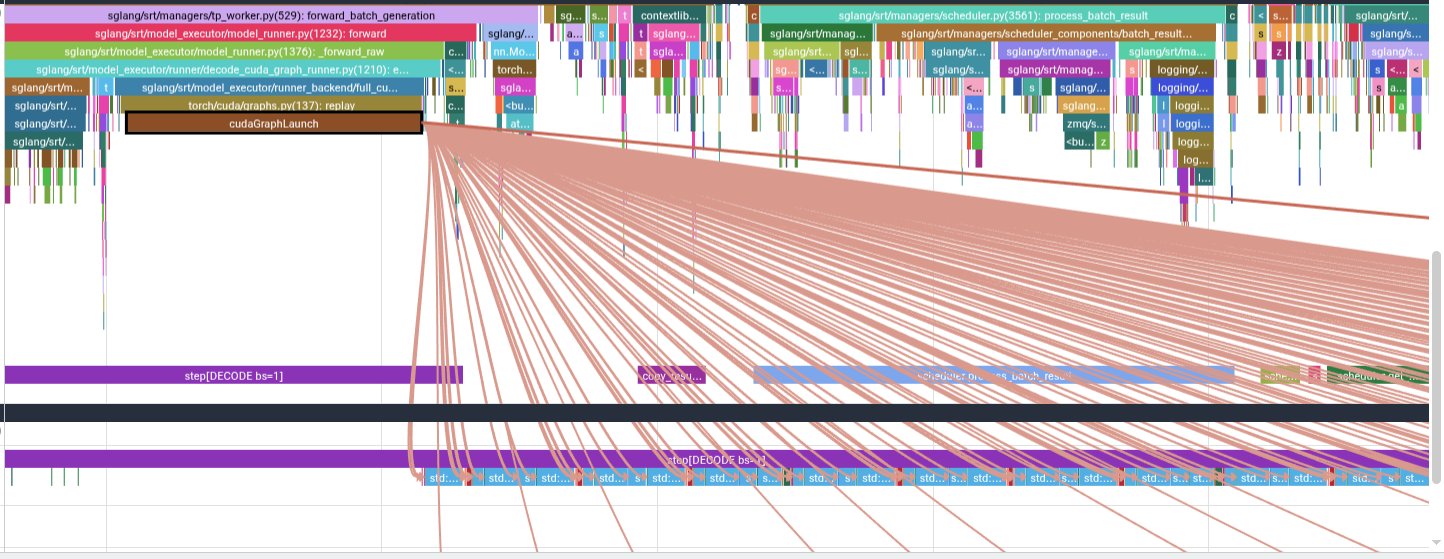
Clicking the graph replay shows the kernels launched by the captured CUDA graph.
Decode Is Dominated by Skinny GEMV
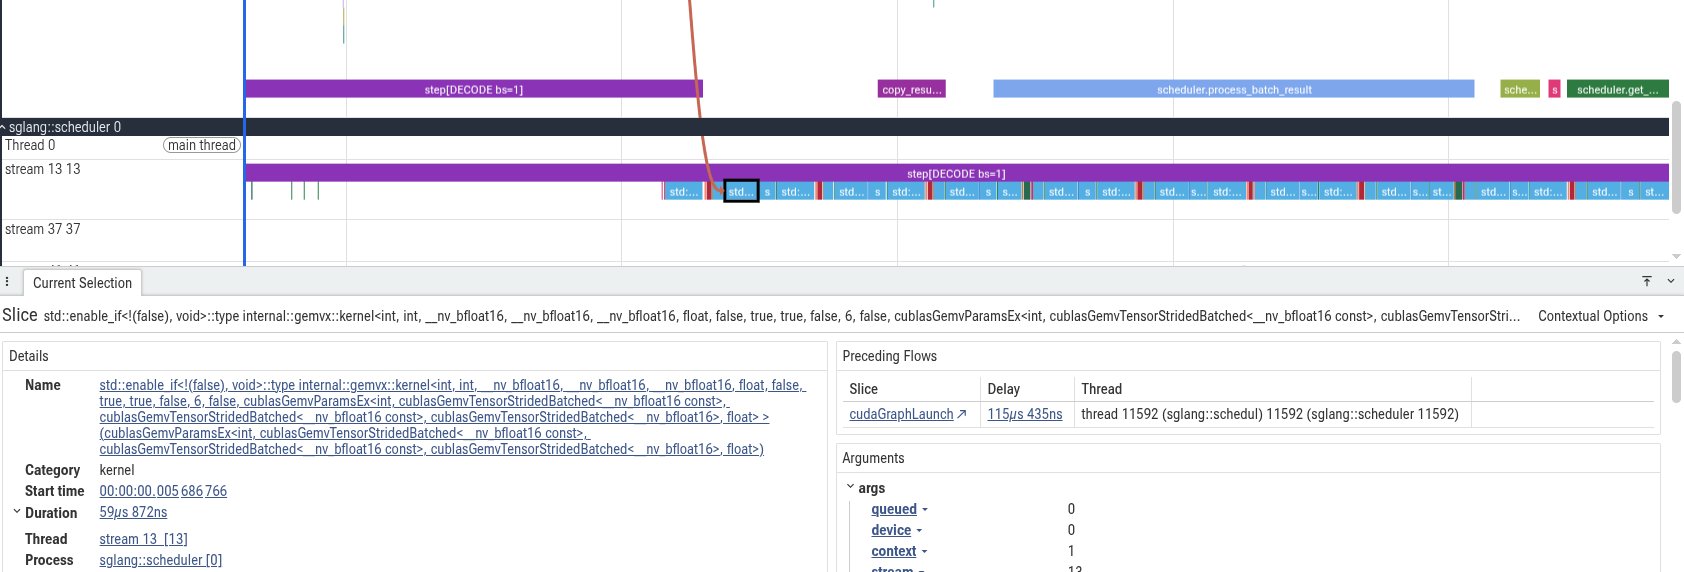
The repeated blue bars are GEMV-family kernels.
The repeated blue bars are the same GEMV family we saw around the vocab projection. In the decode phase, they just keep showing up and this is because for a batch size 1 decode, it simply turns many linear layers into matrix-vector style operations.
This is the core performance issue. GEMV has much lower arithmetic intensity than a large GEMM. You stream a lot of weights from memory, but there is not enough reuse to keep the tensor cores busy in the same way a chunky prefill GEMM can. So even on a GPU with plenty of compute, the decode path can become memory-bandwidth limited.
The tiny red/green/purple blips are other kernels from the hybrid blocks which are important, but for this batch size 1 run, the shape of the trace is mostly screaming one thing - the decode path is a long sequence of skinny projections.
This also explains why batching changes the story. If you increase batch size, some of these skinny operations become less skinny. The workload gets closer to GEMM-like behavior, and the GPU has more opportunity to reuse weights and do useful math per byte loaded. That does not make batching free, because KV cache, latency, scheduling, and memory pressure all matter, but it explains why single-request decode is such a hard shape for GPUs.
Where to go from here?
The next step from here would be to repeat this analysis with larger batches and longer prompts. That would separate which bottlenecks are specific to batch size 1 decode from the ones that stay painful even when the GPU has more parallel work to chew on.